Hammond: Fire Incidents, Wisconsin (WI)
Where are fire incidents reported in Hammond, WI
Something went wrong! Please refresh the page.
|
| |||||||||||||||||||||||||||||||||||||||||||||||||||||||||||||||||||||||||||||||||||||||||||||||||||||||||||||
2002 - 2018 National Fire Incident Reporting System (NFIRS) incidents
- Incident types reported to NFIRS in Hammond, WI
- 12134.2%Fire
- 10730.2%Hazardous Condition
- 6117.2%Rescue & EMS
- 308.5%Good Intent Call
- 267.3%False Alarm
- 82.3%Service Call
- 10.3%Severe Weather
- Fire incident types reported to NFIRS in Hammond, WI
- 6049.6%Structure Fires
- 3024.8%Outside Fires
- 2924.0%Mobile Property/Vehicle Fires
- 21.7%Other
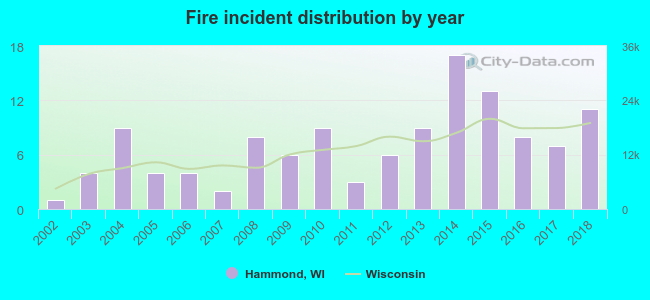 According to the data from the years 2002 - 2018 the average number of fires per year is 7. The highest number of reported fires - 17 took place in 2014, and the least - 1 in 2002. The data has a growing trend.
 35.5% incidents where reported in the morning and 64.5% in the evening. The most fires (21.5%) took place on Thursday, and the least (8.3%) on Tuesday.
 Based on the 121 incident reports from years 2002 - 2018 most fires (14.0%) took place during May, and the least (4.1%) in October.
 Out of all 354 cases reported during the years 2002 - 2018, the most belonged to the categories: Fire (34.2%), Rescue & EMS (30.2%), and Overpressure Rupture (17.2%).
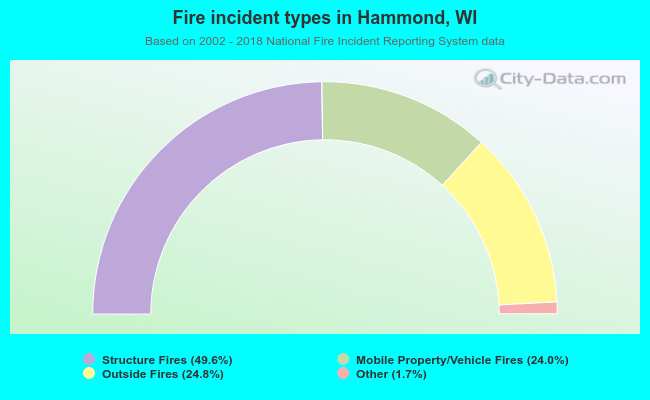 When looking into fire subcategories, the most incidents belonged to: Structure Fires (49.6%), and Outside Fires (24.8%).