| Fire incidents reported |
|---|
| Sreet name | Count |
|---|
| STATE ROUTE 3 | 18 | | 7700 LYNN AVE | 8 | | CHERRY ST | 8 | | HAMLIN RD | 8 | | BIG CREEK RD | 6 | | HAMLIN RD | 6 | | STATE ST | 6 | | TRACECREEK RD | 6 | | UPPER MUD RIVER ROAD | 6 | | 7696 HAMLIN RD | 4 | | 8040 BRIDGE AVE | 4 | | BIG CREEK | 4 | | BRIDGE AVE | 4 | | BUFFALO CREEK RD | 4 | | COURT AVE | 4 | | LYNN AVE | 4 | | LYNN AVE | 4 | | MANSION ST | 4 | | PARK AVE | 4 | | UPPER MUD RIVER RD | 4 | | 105 HILLVIEW DR | 2 | | 105 MANCHION ST | 2 | | 110 TRACE CREEK RD | 2 | | 111 MANSION ST | 2 | | 112 HILLVIEW DR | 2 |
| | | Fire incidents reported |
|---|
| Sreet name | Count |
|---|
| 113 MANSION ST | 2 | | 113 MANSION STREET STRE | 2 | | 125 MAIN ST | 2 | | 132 WOODALL BR | 2 | | 169 BIG BRANCH RD | 2 | | 169 WOODALL BRANCH | 2 | | 1754 UPPER MUD RIVER ROAD | 2 | | 176 SANDLICK RD | 2 | | 183 MIDDLE CRK | 2 | | 183 MIDDLE CRK | 2 | | 191 SAND LICK RD | 2 | | 200 MONDAY DR | 2 | | 205 TRACE CREEK RD | 2 | | 208 WALNUT ST | 2 | | 23 GRANT HOLLOW | 2 | | 239 LITTLE LAUREL CREEK RD | 2 | | 239 LITTLE LAUREL CREEK ROAD | 2 | | 250 SCARY CREEK RD | 2 | | 30 SMITH COUNTRY LN | 2 | | 30 SUNSET DR | 2 | | 300 MAPLE ST | 2 | | 308 MAPLE ST | 2 | | 312 BIG CREEK | 2 | | 314 HIGHLAND ST | 2 | | |
|
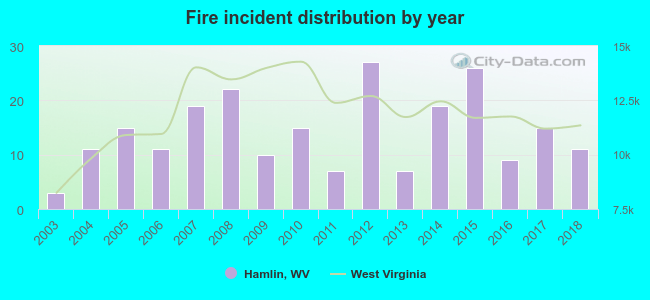 Based on the data from the years 2003 - 2018 the average number of fire incidents per year is 14. The highest number of reported fires - 27 took place in 2012, and the least - 3 in 2003. The data has an increasing trend.
 34.8% incidents where reported in the morning and 65.2% in the evening. The most fires (18.1%) took place on Wednesday, and the least (9.3%) on Thursday.
 According to the 227 fire incidents from years 2003 - 2018 most fires (14.5%) took place during April, and the least (2.2%) in August.
 Out of all 842 cases reported during the years 2003 - 2018, the most belonged to the categories: Hazardous Condition (54.2%), Fire (27.0%), and Rescue & EMS (10.3%).
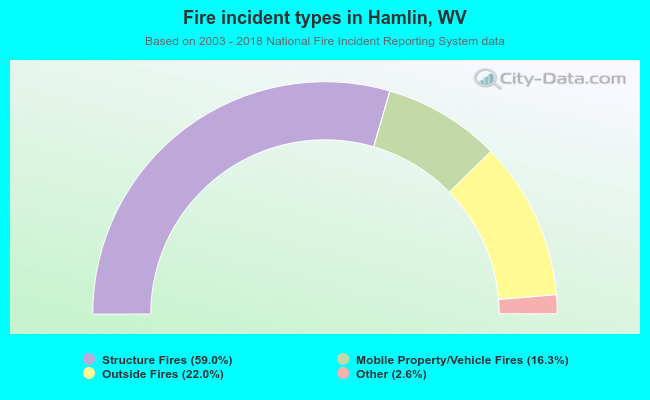 When looking into fire subcategories, the most reports belonged to: Structure Fires (59.0%), and Outside Fires (22.0%).