Hamlet: Fire Incidents, Indiana (IN)
Where are fire incidents reported in Hamlet, IN
Something went wrong! Please refresh the page.
|
| |||||||||||||||||||||||||||||||||||||||||||||||||||||||||||||||||||||||||||||||||||||||||||||||||||||||||||||
| Other | 115 | |||||||||||||||||||||||||||||||||||||||||||||||||||||||||||||||||||||||||||||||||||||||||||||||||||||||||||||
2002 - 2016 National Fire Incident Reporting System (NFIRS) incidents
- Incident types reported to NFIRS in Hamlet, IN
- 26956.9%Fire
- 13227.9%Rescue & EMS
- 337.0%Hazardous Condition
- 245.1%Good Intent Call
- 71.5%Service Call
- 71.5%False Alarm
- 10.2%Overpressure Rupture
- Fire incident types reported to NFIRS in Hamlet, IN
- 11743.5%Outside Fires
- 9535.3%Structure Fires
- 3914.5%Mobile Property/Vehicle Fires
- 186.7%Other
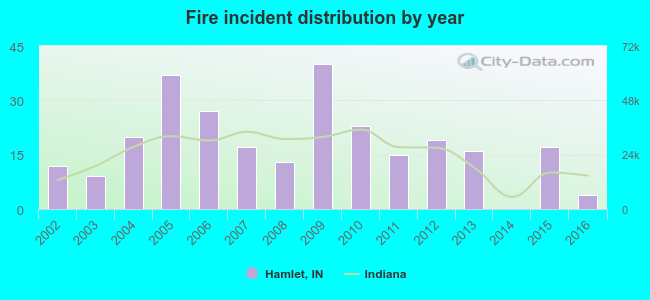 According to the data from the years 2002 - 2016 the average number of fires per year is 18. The highest number of reported fires - 40 took place in 2009, and the least - 0 in 2014. The data has a declining trend.
 30.9% incidents where reported in the morning and 69.1% in the evening. The most fires (16.0%) took place on Wednesday, and the least (12.3%) on Monday.
 Based on the 269 reports from years 2002 - 2016 most fires (17.5%) took place during March, and the least (4.8%) in December.
 Out of all 473 cases reported during the years 2002 - 2016, the most belonged to the categories: Fire (56.9%), Rescue & EMS (27.9%), and Hazardous Condition (7.0%).
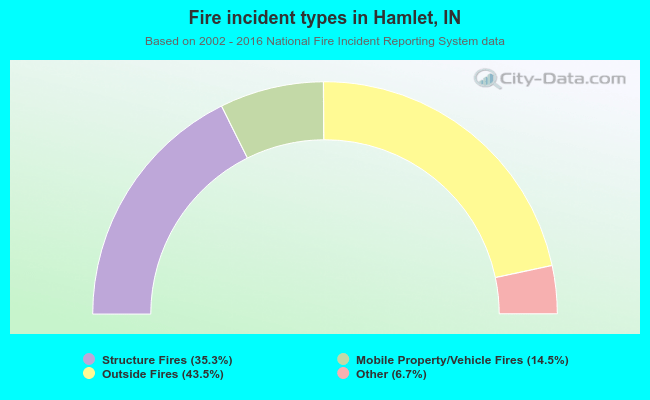 When looking into fire subcategories, the most reports belonged to: Outside Fires (43.5%), and Structure Fires (35.3%).