| Fire incidents reported |
|---|
| Sreet name | Count |
|---|
| STATE ROUTE 774 | 64 | | STATE ROUTE 125 | 54 | | WHITE OAK VALLEY RD | 30 | | BETHEL NEW HOPE RD | 28 | | MAIN ST | 24 | | COLTHAR RD | 22 | | LOVE DAY RD | 18 | | EDEN RD | 14 | | STATE ROUTE 505 | 14 | | FEESBURG POETOWN RD | 12 | | FITE AVE | 12 | | LEONARD RD | 12 | | LUCAS RD | 12 | | LOVE RD | 10 | | LYONS RD | 10 | | SISTERVILLE RD | 10 | | STARLING RD | 10 | | STATE ROUTE 756 | 10 | | YANKEETOWN RD | 10 | | J BOLENDER RD | 8 | | LIMING VAN THOMPSON | 8 | | LIMING VAN THOMPSON RD | 8 | | PIERCE RD | 8 | | PRIDE HILL RD | 8 | | RICHEY RD | 8 |
| | | Fire incidents reported |
|---|
| Sreet name | Count |
|---|
| ROBERTSON RD | 8 | | SMOKEY ROW RD | 8 | | GRIFFITH RD | 6 | | GRISHAM RD | 6 | | 47 CLUB RD | 4 | | 774 | 4 | | BOLENDER RD | 4 | | ELM CORNER RD | 4 | | FRANCIS RD | 4 | | LOVE ROAD | 4 | | OAK GROVE RD | 4 | | OCHARD ST | 4 | | PIRECE RD | 4 | | RICHEY ST | 4 | | SODOM RD | 4 | | SR 774 | 4 | | STRATON RD | 4 | | TRISLER RD | 4 | | TRISTLER RD | 4 | | WATSON RD | 4 | | WHITE SWAN RD | 4 | | WINFIELD DR | 4 | | WINFIELD RD | 4 | | 12046 STATE ROUTE 774 | 2 | | |
|
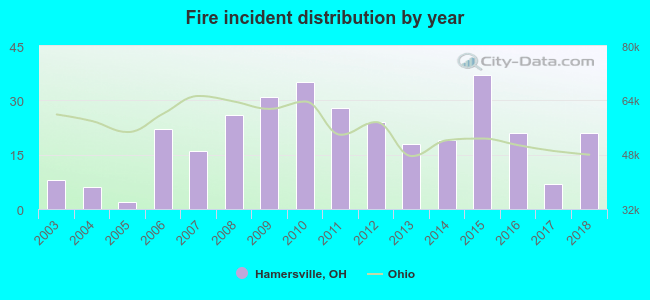 According to the data from the years 2003 - 2018 the average number of fires per year is 20. The highest number of fire incidents - 37 took place in 2015, and the least - 2 in 2005. The data has a rising trend.
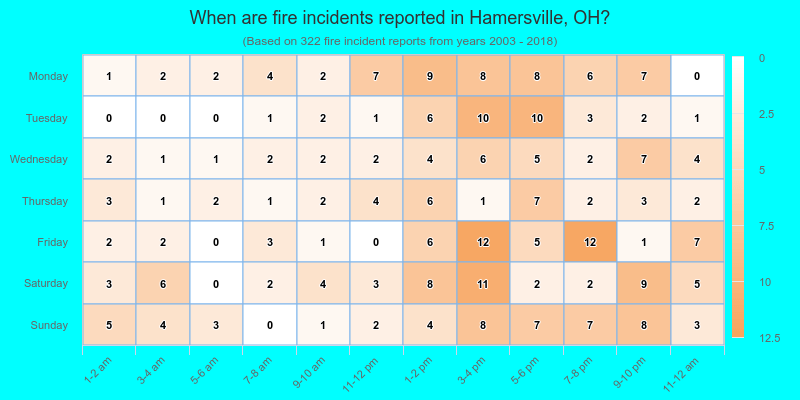
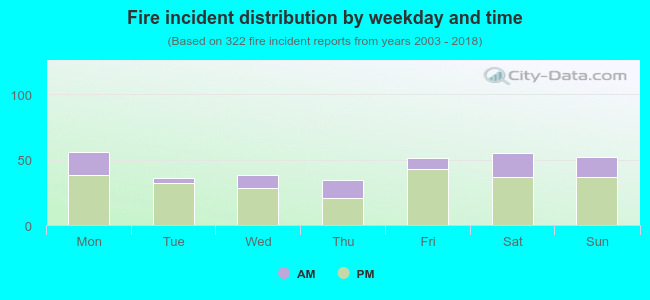 26.7% incidents where reported in the morning and 73.3% in the evening. The most fires (17.4%) took place on Monday, and the least (10.6%) on Thursday.
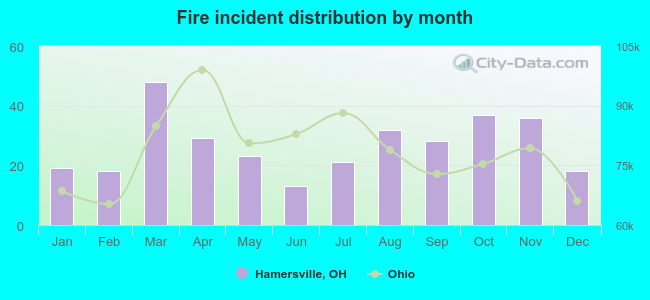 Based on the 322 reports from years 2003 - 2018 most fires (14.9%) took place during March, and the least (4.0%) in June.
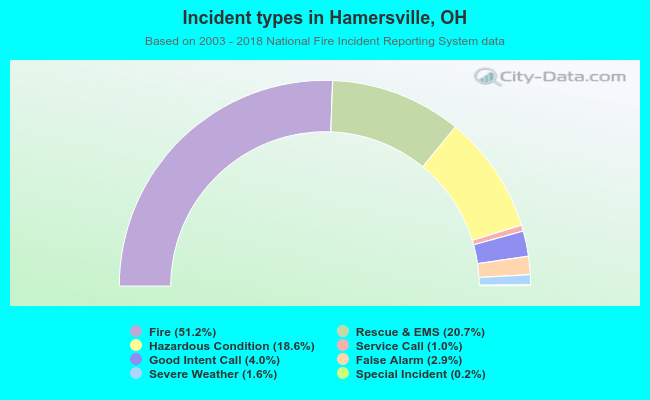 Out of all 629 cases reported during the years 2003 - 2018, the most belonged to the categories: Fire (51.2%), Overpressure Rupture (20.7%), and Rescue & EMS (18.6%).
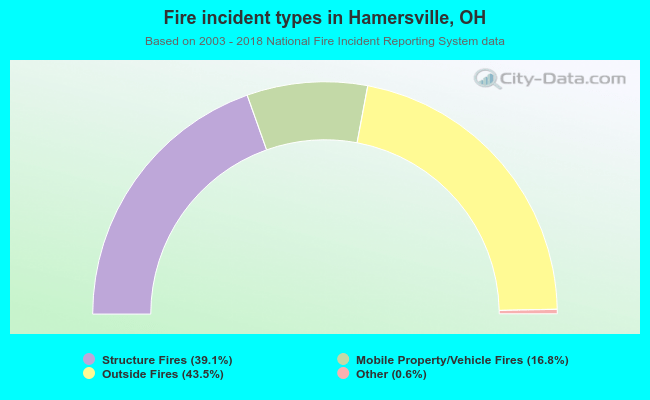 When looking into fire subcategories, the most incidents belonged to: Outside Fires (43.5%), and Structure Fires (39.1%).