Hainesville: Fire Incidents, Illinois (IL)
Where are fire incidents reported in Hainesville, IL
Something went wrong! Please refresh the page.
|
| |||||||||||||||||||||||||||||||||||||||||||||||||||||||||||||||||||||||||||||||||||||||||
2002 - 2018 National Fire Incident Reporting System (NFIRS) incidents
- Incident types reported to NFIRS in Hainesville, IL
- 72758.3%Rescue & EMS
- 18915.1%Hazardous Condition
- 1179.4%Fire
- 977.8%False Alarm
- 715.7%Service Call
- 453.6%Good Intent Call
- 20.2%Overpressure Rupture
- Fire incident types reported to NFIRS in Hainesville, IL
- 6656.4%Structure Fires
- 4336.8%Outside Fires
- 76.0%Mobile Property/Vehicle Fires
- 10.9%Other
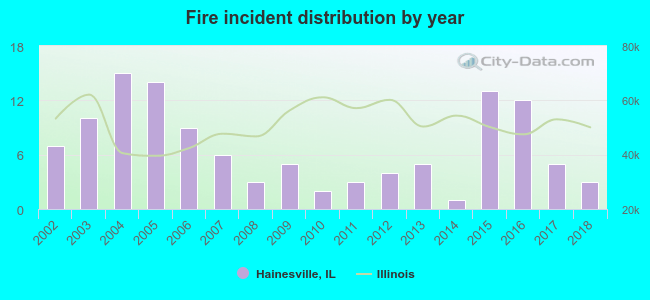 Based on the data from the years 2002 - 2018 the average number of fire incidents per year is 7. The highest number of fire incidents - 15 took place in 2004, and the least - 1 in 2014. The data has a decreasing trend.
 24.8% incidents where reported in the morning and 75.2% in the evening. The most fires (16.2%) took place on Saturday, and the least (12.0%) on Friday.
 Based on the 117 fires from years 2002 - 2018 most fires (13.7%) took place during June, and the least (4.3%) in February.
 Out of all 1,248 cases reported during the years 2002 - 2018, the most belonged to the categories: Rescue & EMS (58.3%), Hazardous Condition (15.1%), and Fire (9.4%).
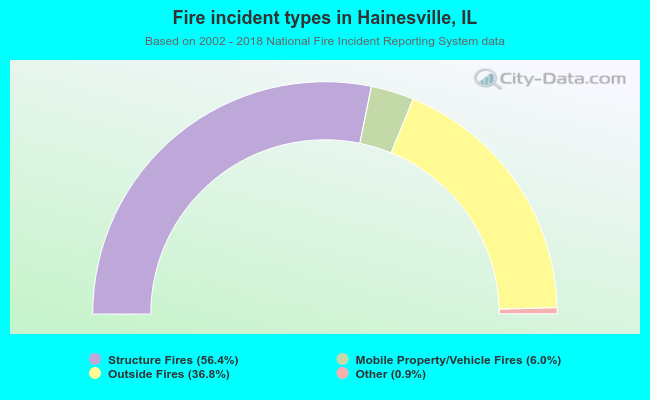 When looking into fire subcategories, the most reports belonged to: Structure Fires (56.4%), and Outside Fires (36.8%).