Hackett: Fire Incidents, Arkansas (AR)
Where are fire incidents reported in Hackett, AR
Something went wrong! Please refresh the page.
|
| |||||||||||||||||||||||||||||||||||||||||||||||||||||||||||||||||||||||||||||||||||||||||||||||||||||||||||||
| Other | 50 | |||||||||||||||||||||||||||||||||||||||||||||||||||||||||||||||||||||||||||||||||||||||||||||||||||||||||||||
2002 - 2018 National Fire Incident Reporting System (NFIRS) incidents
- Incident types reported to NFIRS in Hackett, AR
- 47664.1%Fire
- 18424.8%Rescue & EMS
- 324.3%Hazardous Condition
- 202.7%Service Call
- 182.4%Good Intent Call
- 60.8%Severe Weather
- 50.7%False Alarm
- 10.1%Overpressure Rupture
- 10.1%Special Incident
- Fire incident types reported to NFIRS in Hackett, AR
- 26756.1%Outside Fires
- 18438.7%Structure Fires
- 204.2%Mobile Property/Vehicle Fires
- 51.1%Other
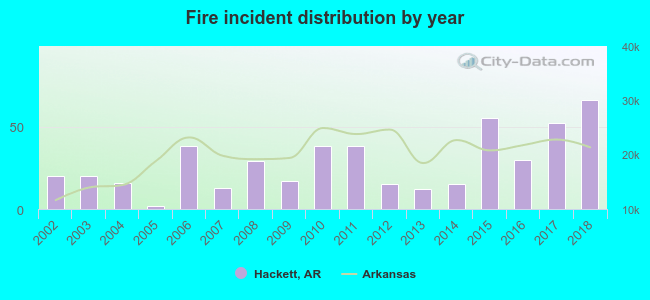 Based on the data from the years 2002 - 2018 the average number of fire incidents per year is 28. The highest number of fires - 66 took place in 2018, and the least - 2 in 2005. The data has a rising trend.
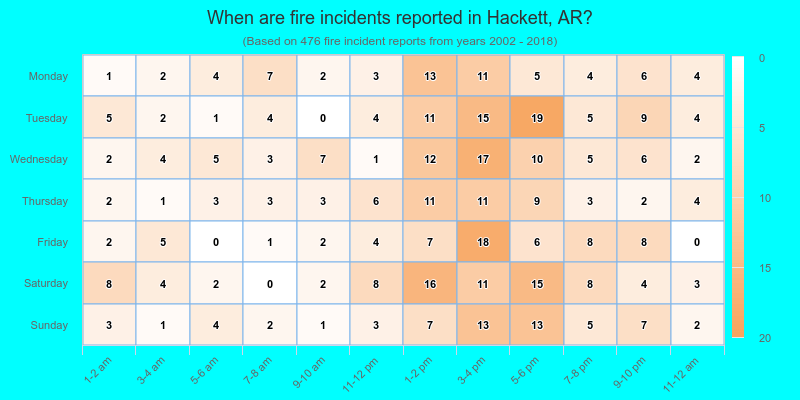
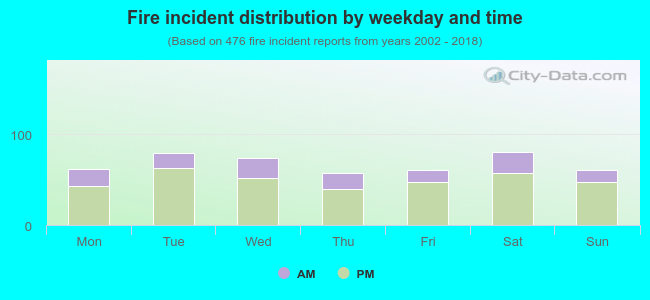 26.7% incidents where reported in the morning and 73.3% in the evening. The most fires (17.0%) took place on Saturday, and the least (12.2%) on Thursday.
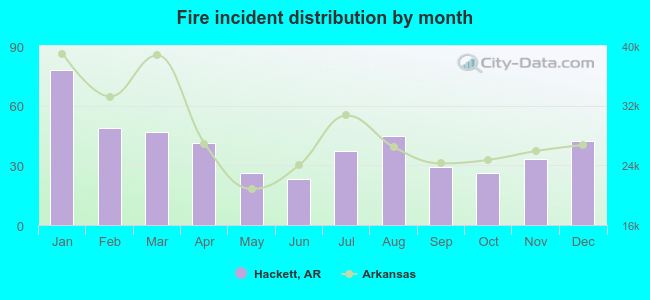 According to the 476 fire incident reports from years 2002 - 2018 most fires (16.4%) took place during January, and the least (4.8%) in June.
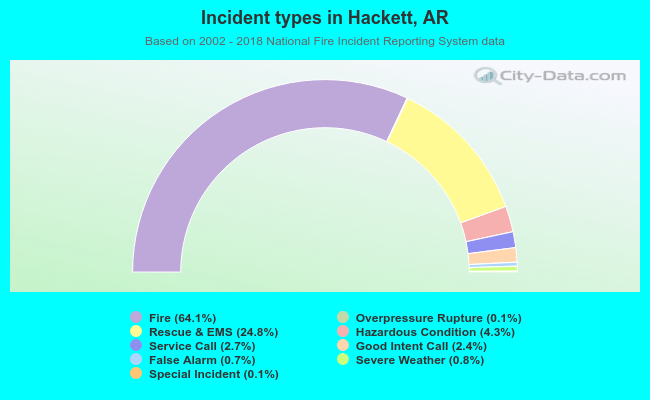 Out of all 743 cases reported during the years 2002 - 2018, the most belonged to the categories: Fire (64.1%), Rescue & EMS (24.8%), and Hazardous Condition (4.3%).
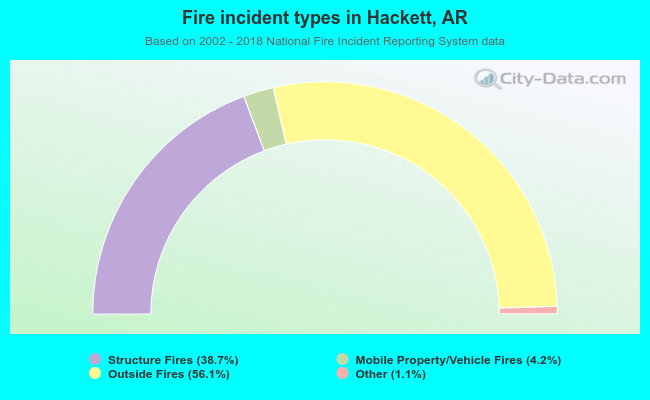 When looking into fire subcategories, the most reports belonged to: Outside Fires (56.1%), and Structure Fires (38.7%).