Gwinn: Fire Incidents, Michigan (MI)
Where are fire incidents reported in Gwinn, MI
Something went wrong! Please refresh the page.
|
| |||||||||||||||||||||||||||||||||||||||||||||||||||||||||||||||||||||||||||||||||||||||||||||||||||||||||||||
| Other | 94 | |||||||||||||||||||||||||||||||||||||||||||||||||||||||||||||||||||||||||||||||||||||||||||||||||||||||||||||
2002 - 2018 National Fire Incident Reporting System (NFIRS) incidents
- Incident types reported to NFIRS in Gwinn, MI
- 33635.6%Fire
- 30232.0%Hazardous Condition
- 14215.0%Rescue & EMS
- 828.7%Good Intent Call
- 404.2%Service Call
- 404.2%False Alarm
- 20.2%Severe Weather
- 10.1%Special Incident
- Fire incident types reported to NFIRS in Gwinn, MI
- 14844.0%Outside Fires
- 13640.5%Structure Fires
- 308.9%Mobile Property/Vehicle Fires
- 226.5%Other
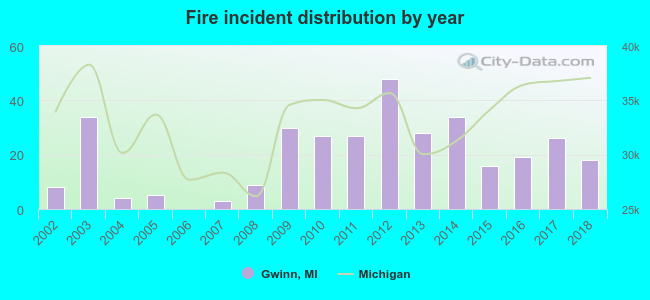 According to the data from the years 2002 - 2018 the average number of fires per year is 20. The highest number of reported fires - 48 took place in 2012, and the least - 0 in 2006. The data has a growing trend.
 25.9% incidents where reported in the morning and 74.1% in the evening. The most fires (17.9%) took place on Saturday, and the least (10.1%) on Wednesday.
 According to the 336 fires from years 2002 - 2018 most fires (18.5%) took place during May, and the least (1.8%) in February.
 Out of all 945 cases reported during the years 2002 - 2018, the most belonged to the categories: Fire (35.6%), Rescue & EMS (32.0%), and Overpressure Rupture (15.0%).
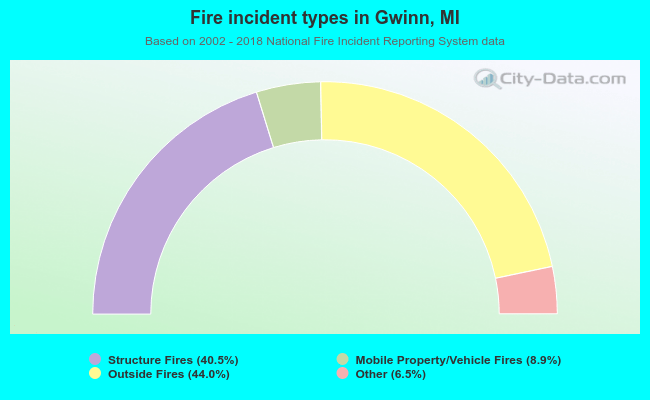 When looking into fire subcategories, the most reports belonged to: Outside Fires (44.0%), and Structure Fires (40.5%).