Guilford: Fire Incidents, Connecticut (CT)
Where are fire incidents reported in Guilford, CT
Something went wrong! Please refresh the page.
| Fire incidents reported | |
|---|---|
| Sreet name | Count |
| BOSTON POST RD | 456 |
| STATE ST | 198 |
| WHITFIELD ST | 110 |
| BOSTON TERR | 108 |
| GUILFORD CT | 104 |
| DURHAM RD | 90 |
| I-95 | 70 |
| LONG HILL RD | 70 |
| DRIVEWAY | 60 |
| LITTLE MEADOW RD | 58 |
| GOOSE LN | 46 |
| CHURCH ST | 44 |
| NEW ENGLAND RD | 42 |
| WATER ST | 42 |
| MOOSE HILL RD | 38 |
| NUT PLAINS RD | 38 |
| I95 | 36 |
| ROUTE 80 | 30 |
| HORSESHOE RD | 28 |
| WEST LAKE AVE | 28 |
| BOSTON POST RD | 26 |
| GREAT HILL RD | 26 |
| BOSTON ST | 24 |
| BROAD ST | 24 |
| GRANITE RD | 24 |
| GUILFORD CITY | 24 |
| MULBERRY POINT RD | 22 |
| WEST ST | 22 |
| LAKE DR | 20 |
| LEETES ISLAND RD | 20 |
2002 - 2018 National Fire Incident Reporting System (NFIRS) incidents
- Incident types reported to NFIRS in Guilford, CT
- 11,90155.8%Rescue & EMS
- 2,56112.0%False Alarm
- 2,39011.2%Service Call
- 1,7718.3%Fire
- 1,6897.9%Hazardous Condition
- 9754.6%Good Intent Call
- 300.1%Special Incident
- Fire incident types reported to NFIRS in Guilford, CT
- 1,21668.7%Structure Fires
- 35420.0%Outside Fires
- 1609.0%Mobile Property/Vehicle Fires
- 412.3%Other
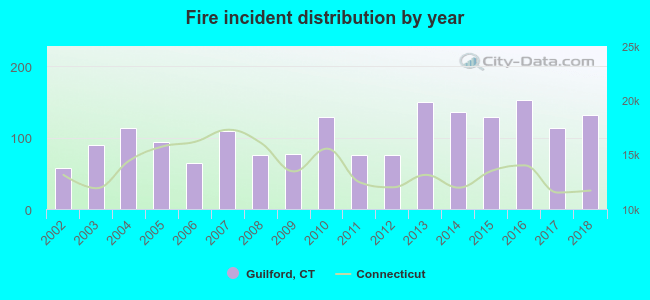 According to the data from the years 2002 - 2018 the average number of fires per year is 104. The highest number of fire incidents - 152 took place in 2016, and the least - 58 in 2002. The data has an increasing trend.
The average number of yearly fire incidents per 10k residents in Guilford, CT compared to nearest cities:
(Note: Based on data for the last 3 years, including only cities with population 5,000 and above)
| Guilford: | 59.3 |
| Madison: | 37.0 |
| North Branford: | 19.0 |
| Branford: | 31.0 |
| Killingworth: | 38.3 |
| East Haven: | 30.2 |
| North Haven: | 56.3 |
| New Haven: | 29.0 |
| Wallingford: | 27.8 |
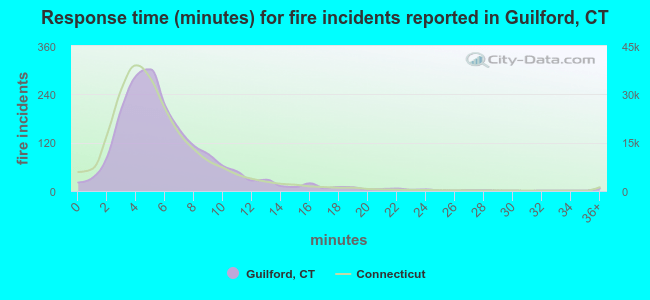 The median response time based on all reported fire incidents is 5 minutes. This is comparable to the state median value.
The median response time in Guilford, CT compared to nearest cities:
(Note: Based on data for all years, including only cities with at least 500 fire incidents)
| Guilford: | 5 minutes |
| Madison: | 6 minutes |
| North Branford: | 6 minutes |
| Branford: | 5 minutes |
| East Haven: | 4 minutes |
| Clinton: | 6 minutes |
| North Haven: | 6 minutes |
| New Haven: | 4 minutes |
| Wallingford: | 6 minutes |
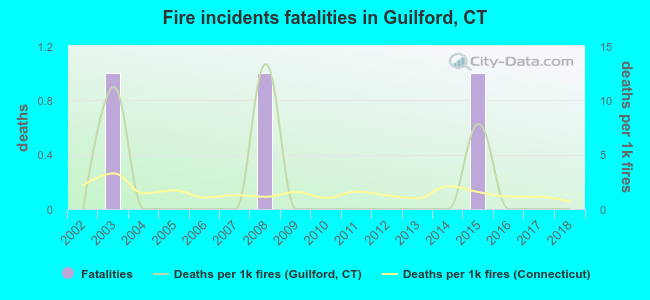 According to the reports from the years 2002 - 2018 the average number of fire-related fatalities per year is 0. The highest number of deaths - 1 took place in 2003, and the lowest - 0 in 2002. The data has a constant trend.
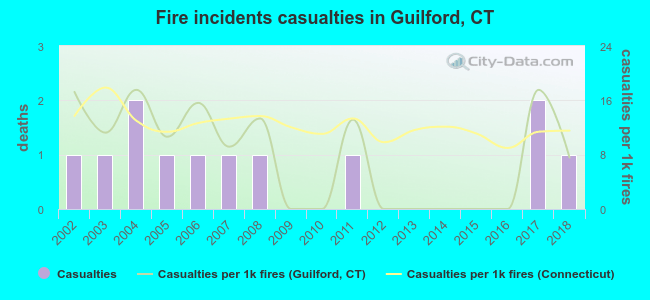 According to the data from the years 2002 - 2018 the average number of fire-related casualties per year is 1. The highest number of casualties - 2 took place in 2004, and the lowest - 0 in 2009. The data has a constant trend.
The average number of injuries per 1,000 fire incidents is 8. This indicator was the highest - 18 in 2004, and the lowest 0 in 2009. The trend for casualties per 1,000 fires is dropping. Compared to the Connecticut value the number of casualties per 1,000 incidents is lower.
According to the data from the years 2002 - 2018 the average number of fire-related casualties per year is 1. The highest number of casualties - 2 took place in 2004, and the lowest - 0 in 2009. The data has a constant trend.
The average number of injuries per 1,000 fire incidents is 8. This indicator was the highest - 18 in 2004, and the lowest 0 in 2009. The trend for casualties per 1,000 fires is dropping. Compared to the Connecticut value the number of casualties per 1,000 incidents is lower.Casualties per 1,000 incidents in Guilford, CT compared to nearest cities:
(Note: Based on data for all years, including only cities with at least 500 fire incidents)
| Guilford: | 6.8 |
| Madison: | 14.6 |
| North Branford: | 20.1 |
| Branford: | 18.7 |
| East Haven: | 23.6 |
| Clinton: | 1.0 |
| North Haven: | 14.9 |
| New Haven: | 2.7 |
| Wallingford: | 14.4 |
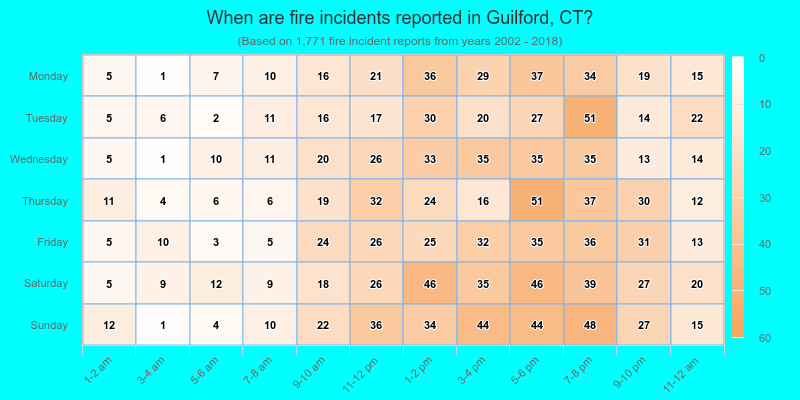
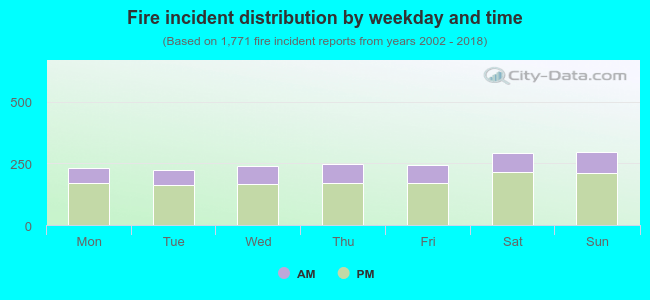 28.5% incidents where reported in the morning and 71.5% in the evening. The most fires (16.8%) took place on Sunday, and the least (12.5%) on Tuesday.
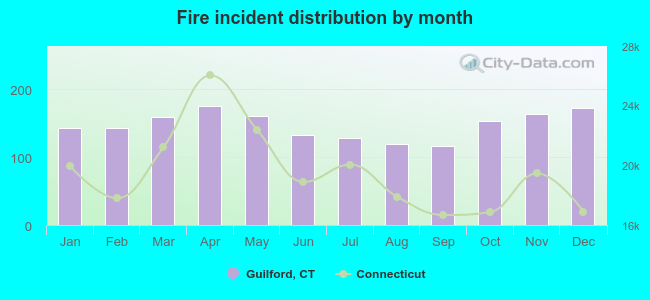 Based on the 1,771 incident reports from years 2002 - 2018 most fires (9.9%) took place during April, and the least (6.6%) in September.
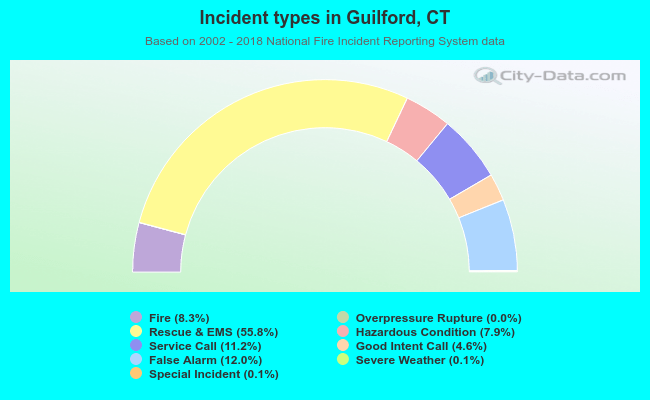 Out of all 21,341 cases reported during the years 2002 - 2018, the most belonged to the categories: Rescue & EMS (55.8%), False Alarm (12.0%), and Service Call (11.2%).
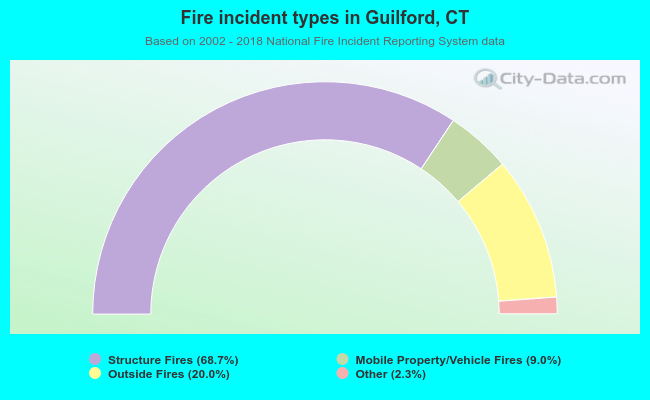 When looking into fire subcategories, the most incidents belonged to: Structure Fires (68.7%), and Outside Fires (20.0%).