| Fire incidents reported |
|---|
| Sreet name | Count |
|---|
| BRAZNELL RD | 30 | | GRINDSTONE RD | 28 | | CENTER ST | 12 | | FORDS HILL RD | 8 | | RAILROAD ST | 8 | | FRONT ST | 6 | | NATIONAL PIKE | 6 | | 2ND ST | 4 | | BRAZNELL ROAD | 4 | | COLONIAL AVE | 4 | | HILLTOP AVE | 4 | | LYNNDALE RD | 4 | | MURPHY RD | 4 | | NEW HILL RD | 4 | | TIPPIECANOE RD | 4 | | 1549 BRAZNELL ROAD | 2 | | 1605 GRINDSTONE ROAD | 2 | | 2509 2ND ST | 2 | | 2ND ST. ROWES RUN | 2 | | 356 STUCKSLAGER RD | 2 | | 3RD ST | 2 | | 3RD STREET | 2 | | 4 ST | 2 | | 4TH ST | 2 | | 5 ST | 2 |
| | | Fire incidents reported |
|---|
| Sreet name | Count |
|---|
| 509 PARK ST | 2 | | 6697 NAT PIKE RD | 2 | | 723 BRAZNELL RD. | 2 | | ALBANY RD | 2 | | BREWER ROAD | 2 | | CHURCH ST | 2 | | ENTER SEARCH TEXT HERE RD | 2 | | FARQUHER LN | 2 | | FORDS HILL GRINDSTONE RD | 2 | | FOURTH ST | 2 | | HILLSIDE AVE | 2 | | HILLSIDE ROAD | 2 | | HILLTOP AV | 2 | | HILTOP LN | 2 | | HUNTERS RIDGE RDG | 2 | | JACKSON RD | 2 | | LAURELDALE RD | 2 | | LYNDALE RD | 2 | | LYNN BOTTOM RD | 2 | | LYNN RD | 2 | | MADISON ST | 2 | | MAIN ST | 2 | | NATIONAL PIKE | 2 | | NEW HILL | 2 | | |
|
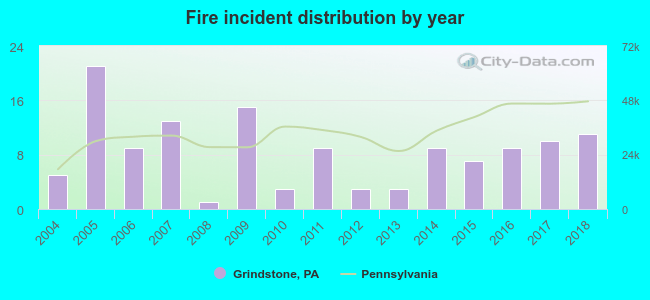 Based on the data from the years 2004 - 2018 the average number of fires per year is 9. The highest number of reported fires - 21 took place in 2005, and the least - 1 in 2008. The data has a growing trend.
 46.9% incidents where reported in the morning and 53.1% in the evening. The most fires (24.2%) took place on Sunday, and the least (8.6%) on Monday.
 According to the 128 fires from years 2004 - 2018 most fires (16.4%) took place during March, and the least (3.1%) in April.
 Out of all 227 cases reported during the years 2004 - 2018, the most belonged to the categories: Fire (56.4%), Overpressure Rupture (21.6%), and Service Call (6.2%).
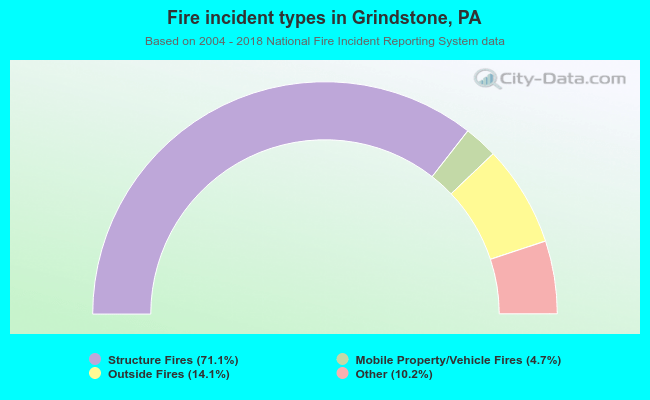 When looking into fire subcategories, the most incidents belonged to: Structure Fires (71.1%), and Outside Fires (14.1%).