| Fire incidents reported |
|---|
| Sreet name | Count |
|---|
| HWY 11 | 16 | | 298 SENKO RD | 6 | | 1075 HWY 323 SOUTH | 4 | | 1127 HWY. 11 | 4 | | 1200 HWY 385 | 4 | | 1224 HWY 385 SOUTH | 4 | | 2261 HWY 11 | 4 | | 2388 HWY 11 | 4 | | 2591 HWY 11 | 4 | | 307 BAILEY ST | 4 | | 788 BURROWS RD | 4 | | 831 BAYOU RD | 4 | | 931 FLETCHER ELLIS RD | 4 | | BAYOU RD | 4 | | CANE RD | 4 | | COLWELL RD | 4 | | F 2297 HWY 11 | 4 | | FLETCHER ELLIS RD | 4 | | HWY 11N | 4 | | RAFT CREEK RD | 4 | | RAFT CREEK RD | 4 | | SOUTH END OF BRITTON FORD RD | 4 | | WAIRE POND RD | 4 | | WHITE CO LINE RD | 4 | | 100 BLOCK OF WALDEN RD | 2 |
| | | Fire incidents reported |
|---|
| Sreet name | Count |
|---|
| 102 SECOND ST | 2 | | 103 MOODY RD | 2 | | 1033 HWY 11 | 2 | | 112 LEN AVE | 2 | | 1199 HWY 11 | 2 | | 12 MILE WEST OF 228 BAYOU RD | 2 | | 1224 HWY 385 S | 2 | | 1240 HWY 385 | 2 | | 1410 RAFT CREEK RD | 2 | | 1500 BLOCK OF HWY 11 | 2 | | 15200 HWY 11 N | 2 | | 1523 HWY 11 | 2 | | 16026 HWY 11 | 2 | | 165 HUBBARD RD | 2 | | 1702 HWY 11 | 2 | | 1706 HWY 11 | 2 | | 172 COOPER LOOP | 2 | | 175 JACK STEWART RD | 2 | | 17655 PAM LN | 2 | | 178 MOORE RD | 2 | | 183 DOGWOOD CHURCH RD | 2 | | 1842 HIGHWAY 11 | 2 | | 1843 HWY 11 | 2 | | 18523 ALLRED RD | 2 | | |
|
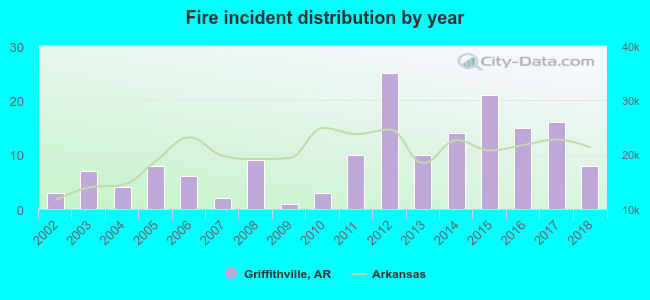 Based on the data from the years 2002 - 2018 the average number of fire incidents per year is 10. The highest number of fires - 25 took place in 2012, and the least - 1 in 2009. The data has a rising trend.
 31.5% incidents where reported in the morning and 68.5% in the evening. The most fires (20.4%) took place on Saturday, and the least (9.9%) on Monday.
 According to the 162 fire incident reports from years 2002 - 2018 most fires (14.2%) took place during November, and the least (5.6%) in April.
 Out of all 267 cases reported during the years 2002 - 2018, the most belonged to the categories: Fire (60.7%), Overpressure Rupture (25.5%), and Service Call (5.6%).
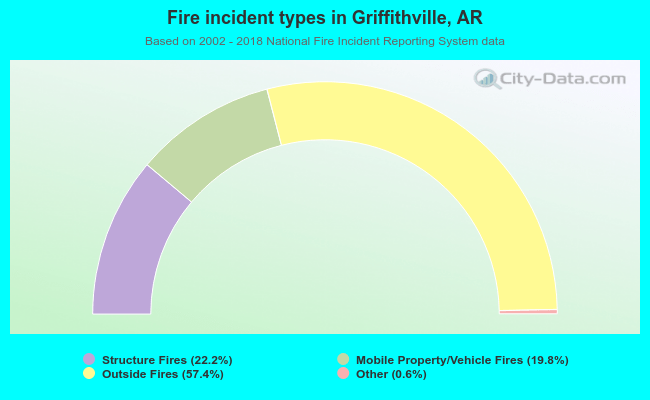 When looking into fire subcategories, the most reports belonged to: Outside Fires (57.4%), and Structure Fires (22.2%).