| Fire incidents reported |
|---|
| Sreet name | Count |
|---|
| CIRCLE DR | 8 | | CHURCH ST | 6 | | HARDAWAY HWY | 6 | | NORTH AVE | 6 | | 233 MARTIN LUTHER KING | 4 | | BEAVER LAKE | 4 | | DEWEY JOHNSON WY | 4 | | EAST CIRCLE DRIVE | 4 | | GREENSBORO HWY | 4 | | JACKSON LN | 4 | | LAKE GRETNA DR | 4 | | MAGNOLIA DR | 4 | | MLK | 4 | | SOUTH AVE | 4 | | THOMAS AVE | 4 | | WILLIAMS ST | 4 | | 1051 HARDAWAY HWY | 2 | | 10511 HARDAWAY HWY | 2 | | 107 LAKE GRETNA DR. | 2 | | 110 THOMAS AVE | 2 | | 116 CHAD LN | 2 | | 118 THOMAS AVE | 2 | | 1316 JACKSON LANE | 2 | | 140 NORTH AVE | 2 | | 173 TAYLOR RD | 2 |
| | | Fire incidents reported |
|---|
| Sreet name | Count |
|---|
| 174 SOUTH AVE | 2 | | 1ST ST | 2 | | 1ST STREET | 2 | | 1ST STREET ST | 2 | | 200 WEST CIRCLE DR. | 2 | | 209 WEST CIRCLE DR. | 2 | | 210 THOMAS AVE | 2 | | 235 LAKE GRETNA | 2 | | 25 BETTY BOO LN | 2 | | 33 CHURCH ST | 2 | | 3RD STRE | 2 | | 412 HALL LN | 2 | | 5553 HOSFORD HWY | 2 | | 583 WILLIAMS ST | 2 | | 6 MCQUEEN LN. | 2 | | 60 MCMILLIAN LN. | 2 | | 6044 GREENSBORO HWY | 2 | | 65 HWY | 2 | | 673 MATTHEW CLARK RD | 2 | | 706 MLK BLVD | 2 | | 75 SMITH CIRCLE | 2 | | 830 HOPKINS LANE | 2 | | 85 HENRY DR | 2 | | 85 HERNY DRIVE | 2 | | |
|
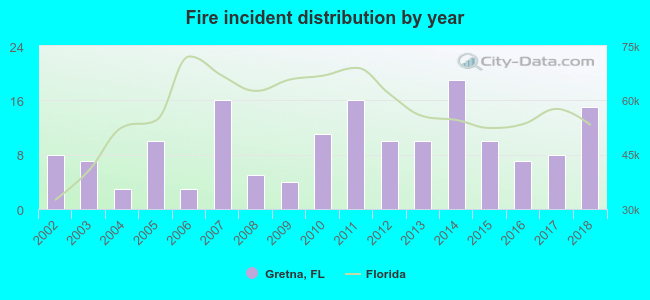 Based on the data from the years 2002 - 2018 the average number of fire incidents per year is 10. The highest number of reported fire incidents - 19 took place in 2014, and the least - 3 in 2004. The data has a rising trend.
 34.0% incidents where reported in the morning and 66.0% in the evening. The most fires (19.1%) took place on Wednesday, and the least (8.6%) on Monday.
 According to the 162 fire incidents from years 2002 - 2018 most fires (16.7%) took place during January, and the least (2.5%) in October.
 Out of all 255 cases reported during the years 2002 - 2018, the most belonged to the categories: Fire (63.5%), Service Call (11.4%), and Overpressure Rupture (8.2%).
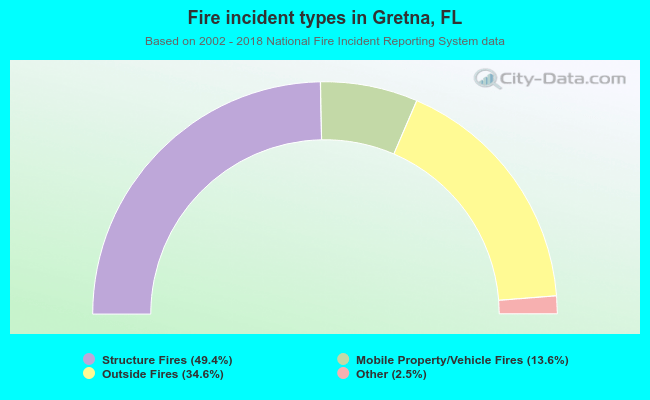 When looking into fire subcategories, the most incidents belonged to: Structure Fires (49.4%), and Outside Fires (34.6%).