| Fire incidents reported |
|---|
| Sreet name | Count |
|---|
| 181 HWY | 22 | | 3284 | 18 | | 35 HWY | 18 | | US 181 | 18 | | HWY 35 | 10 | | 361 HWY | 8 | | HWY 136 | 8 | | CR 3284 | 6 | | FM 136 | 6 | | FM 2986 | 6 | | 1023 SUNSET | 4 | | 136 | 4 | | CR 102 | 4 | | CR 98 | 4 | | FM 3284 | 4 | | FRANKLIN | 4 | | GREGORY ST | 4 | | HWY 181 AT CR 3667 | 4 | | HWY 35 HWY | 4 | | HWY 361 | 4 | | RR TRACK BETWEEN 3RD 4TH ST | 4 | | SF AUSTIN SCHOOL | 4 | | SS 202 | 4 | | US HIGHWAY 181 | 4 | | US HWY 181 | 4 |
| | | Fire incidents reported |
|---|
| Sreet name | Count |
|---|
| "C" AVE | 2 | | 10 MILES S BAYSIDE | 2 | | 102 SUNSET | 2 | | 109 N AVE B AVE | 2 | | 117 CAROLE ST | 2 | | 117 LEE AVE AVE | 2 | | 133 COLIMA | 2 | | 136 3 MILES NORTH OF 35 HWY | 2 | | 136 AND 3284 | 2 | | 136 AND CR1177 | 2 | | 136 AND HWY 35 BYPASS | 2 | | 1360 FLT | 2 | | 1360 RD | 2 | | 181 | 2 | | 181 ACCESS RDNORTH ST | 2 | | 181 MIDWAY GIN HWY | 2 | | 181 NORTHBOUND MEDIAN | 2 | | 181 OVERPASS SOUTH BOUND HWY | 2 | | 181 SUNSET | 2 | | 200 BLK 3RD ST ST | 2 | | 202 CHILDRESS | 2 | | 202COTTEN GIN | 2 | | 207 AVE B AVE | 2 | | 208 STATE ST. | 2 | | |
|
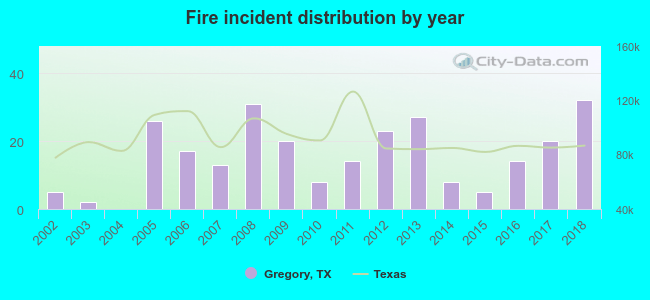 According to the data from the years 2002 - 2018 the average number of fire incidents per year is 16. The highest number of fire incidents - 32 took place in 2018, and the least - 0 in 2004. The data has a rising trend.
 24.9% incidents where reported in the morning and 75.1% in the evening. The most fires (18.5%) took place on Wednesday, and the least (10.2%) on Tuesday.
 Based on the 265 reports from years 2002 - 2018 most fires (13.2%) took place during May, and the least (3.8%) in October.
 Out of all 409 cases reported during the years 2002 - 2018, the most belonged to the categories: Fire (64.8%), Rescue & EMS (19.8%), and Overpressure Rupture (8.3%).
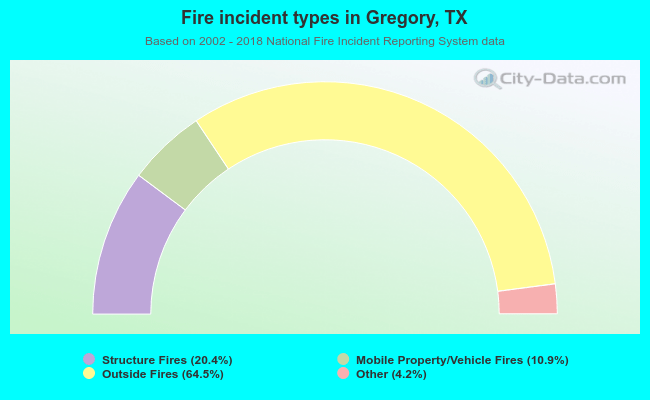 When looking into fire subcategories, the most incidents belonged to: Outside Fires (64.5%), and Structure Fires (20.4%).