Greenwood: Fire Incidents, Florida (FL)
Where are fire incidents reported in Greenwood, FL
Something went wrong! Please refresh the page.
|
| |||||||||||||||||||||||||||||||||||||||||||||||||||||||||||||||||||||||||||||||||||||||||||||||||||||||||||||
2002 - 2018 National Fire Incident Reporting System (NFIRS) incidents
- Incident types reported to NFIRS in Greenwood, FL
- 75072.7%Rescue & EMS
- 17717.2%Fire
- 706.8%Good Intent Call
- 161.6%Hazardous Condition
- 90.9%False Alarm
- 60.6%Service Call
- 20.2%Special Incident
- Fire incident types reported to NFIRS in Greenwood, FL
- 7743.5%Outside Fires
- 5832.8%Structure Fires
- 3318.6%Mobile Property/Vehicle Fires
- 95.1%Other
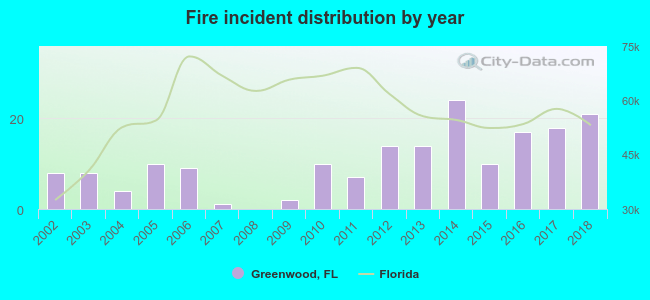 According to the data from the years 2002 - 2018 the average number of fires per year is 10. The highest number of fire incidents - 24 took place in 2014, and the least - 0 in 2008. The data has a growing trend.
 20.3% incidents where reported in the morning and 79.7% in the evening. The most fires (16.4%) took place on Wednesday, and the least (10.2%) on Thursday.
 Based on the 177 incident reports from years 2002 - 2018 most fires (13.0%) took place during March, and the least (3.4%) in September.
 Out of all 1,032 cases reported during the years 2002 - 2018, the most belonged to the categories: Rescue & EMS (72.7%), Fire (17.2%), and Good Intent Call (6.8%).
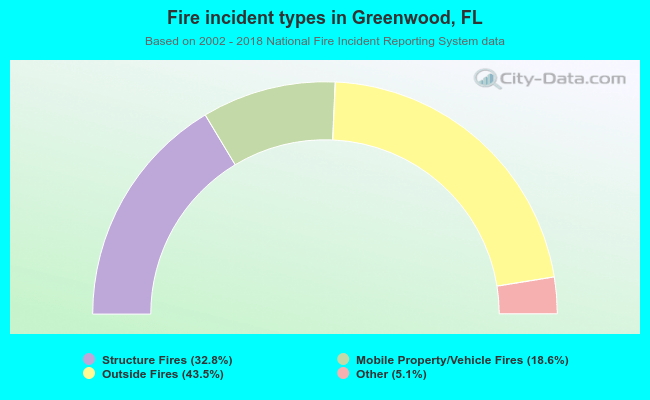 When looking into fire subcategories, the most incidents belonged to: Outside Fires (43.5%), and Structure Fires (32.8%).