Greenville: Fire Incidents, South Carolina (SC)
Where are fire incidents reported in Greenville, SC
Something went wrong! Please refresh the page.
| Fire incidents reported | |
|---|---|
| Sreet name | Count |
| MAIN ST | 1,844 |
| AUGUSTA ST | 1,182 |
| WHITE HORSE RD | 698 |
| WASHINGTON ST | 558 |
| PLEASANTBURG DR | 472 |
| WOODRUFF RD | 408 |
| NORTH ST | 342 |
| AUGUSTA RD | 292 |
| POINSETT HWY | 286 |
| PELHAM RD | 278 |
| WADE HAMPTON BLVD | 272 |
| ANDERSON RD | 238 |
| LAURENS RD | 230 |
| RUTHERFORD RD | 210 |
| HAYWOOD RD | 208 |
| OLD BUNCOMBE RD | 206 |
| CEDAR LANE RD | 180 |
| GROVE RD | 172 |
| CLEVELAND ST | 170 |
| FURMAN HALL RD | 156 |
| STATE PARK RD | 140 |
| BLUE RIDGE DR | 132 |
| THRUSTON ST | 132 |
| I85 | 128 |
| MAULDIN RD | 120 |
| PARKER RD | 110 |
| VILLA RD | 110 |
| I-85 | 100 |
| RUTHERFORD ST | 100 |
| DIXIE CIR | 92 |
| Other | 5,828 |
2002 - 2018 National Fire Incident Reporting System (NFIRS) incidents
- Incident types reported to NFIRS in Greenville, SC
- 37,22940.5%Rescue & EMS
- 15,39416.8%Fire
- 12,10113.2%False Alarm
- 11,55612.6%Hazardous Condition
- 9,66810.5%Service Call
- 5,2705.7%Good Intent Call
- 2550.3%Severe Weather
- 2550.3%Special Incident
- 1250.1%Overpressure Rupture
- Fire incident types reported to NFIRS in Greenville, SC
- 7,35747.8%Structure Fires
- 5,14533.4%Outside Fires
- 2,35115.3%Mobile Property/Vehicle Fires
- 5413.5%Other
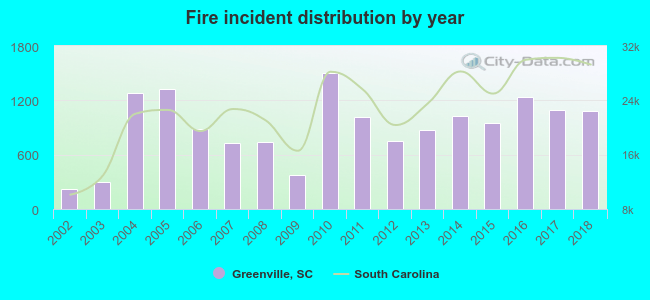 Based on the data from the years 2002 - 2018 the average number of fire incidents per year is 906. The highest number of reported fire incidents - 1,499 took place in 2010, and the least - 226 in 2002. The data has an increasing trend.
The average number of yearly fire incidents per 10k residents in Greenville, SC compared to nearest cities:
(Note: Based on data for the last 3 years, including only cities with population 5,000 and above)
| Greenville: | 183.0 |
| Gantt: | 0.7 |
| Berea: | 0.7 |
| Taylors: | 61.7 |
| Mauldin: | 30.6 |
| Powderville: | 49.0 |
| Simpsonville: | 61.9 |
| Piedmont: | 313.5 |
| Greer: | 107.6 |
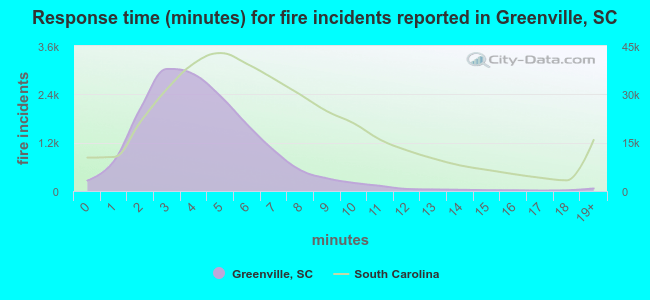 The median response time based on all reported fire incidents is 4 minutes. This is lower than the South Carolina median value.
The median response time in Greenville, SC compared to nearest cities:
(Note: Based on data for all years, including only cities with at least 500 fire incidents)
| Greenville: | 4 minutes |
| Taylors: | 5 minutes |
| Mauldin: | 3 minutes |
| Travelers Rest: | 7 minutes |
| Simpsonville: | 4 minutes |
| Piedmont: | 6 minutes |
| Greer: | 5 minutes |
| Easley: | 6 minutes |
| Pelzer: | 6 minutes |
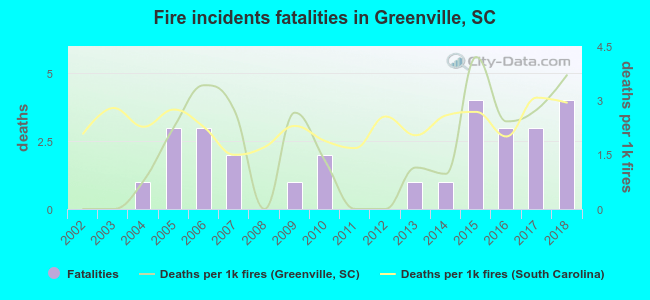 Based on the reports from the years 2002 - 2018 the average number of fire-related yearly deaths is 2. The highest number of reported deaths - 4 took place in 2015, and the lowest - 0 in 2002. The data has a growing trend.
The average number of deaths per 1,000 fires is 2. This indicator was the highest - 4 in 2015, and the lowest 0 in 2002. The trend for deaths per 1,000 fire incidents is increasing. Compared to the state value the number of fatalities per 1,000 fire incidents is lower.
Based on the reports from the years 2002 - 2018 the average number of fire-related yearly deaths is 2. The highest number of reported deaths - 4 took place in 2015, and the lowest - 0 in 2002. The data has a growing trend.
The average number of deaths per 1,000 fires is 2. This indicator was the highest - 4 in 2015, and the lowest 0 in 2002. The trend for deaths per 1,000 fire incidents is increasing. Compared to the state value the number of fatalities per 1,000 fire incidents is lower.Deaths per 1,000 incidents in Greenville, SC compared to nearest cities:
(Note: Based on data for all years, including only cities with at least 2,500 fire incidents)
| Greenville: | 1.8 |
| Greer: | 3.9 |
| Easley: | 2.7 |
| Spartanburg: | 2.0 |
| Anderson: | 3.0 |
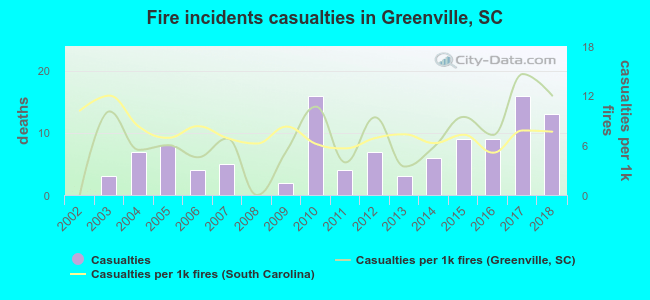 According to the reports from the years 2002 - 2018 the average number of fire-related yearly casualties is 7. The highest number of reported injuries - 16 took place in 2010, and the lowest - 0 in 2002. The data has a rising trend.
The average number of casualties per 1,000 fires is 7. This indicator was the highest - 15 in 2017, and the lowest 0 in 2002. The trend for casualties per 1,000 incidents is growing. Compared to the South Carolina value the number of casualties per 1,000 fire incidents is about the same.
According to the reports from the years 2002 - 2018 the average number of fire-related yearly casualties is 7. The highest number of reported injuries - 16 took place in 2010, and the lowest - 0 in 2002. The data has a rising trend.
The average number of casualties per 1,000 fires is 7. This indicator was the highest - 15 in 2017, and the lowest 0 in 2002. The trend for casualties per 1,000 incidents is growing. Compared to the South Carolina value the number of casualties per 1,000 fire incidents is about the same.Casualties per 1,000 incidents in Greenville, SC compared to nearest cities:
(Note: Based on data for all years, including only cities with at least 500 fire incidents)
| Greenville: | 7.3 |
| Taylors: | 6.0 |
| Mauldin: | 6.2 |
| Travelers Rest: | 1.5 |
| Simpsonville: | 5.3 |
| Piedmont: | 3.8 |
| Greer: | 5.2 |
| Easley: | 3.5 |
| Pelzer: | 1.4 |
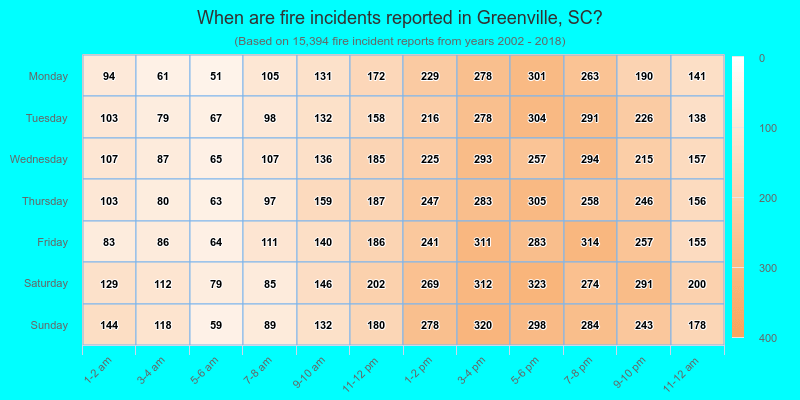
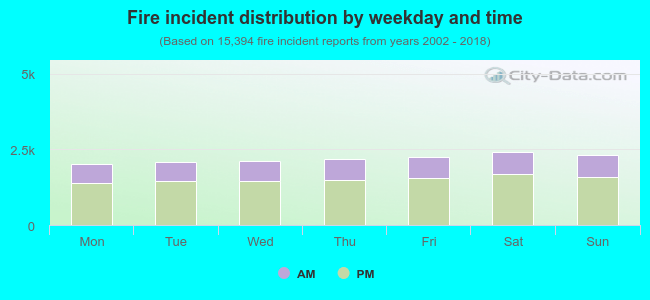 31.0% incidents where reported in the morning and 69.0% in the evening. The most fires (15.7%) took place on Saturday, and the least (13.1%) on Monday.
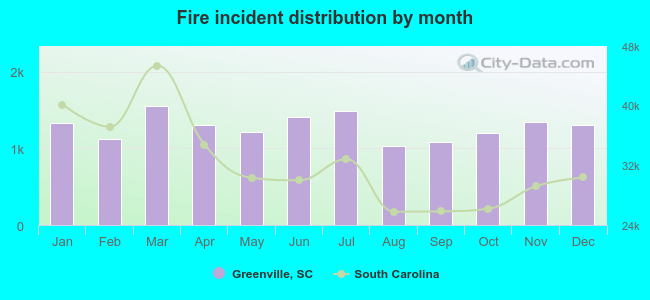 According to the 15,394 reports from years 2002 - 2018 most fires (10.1%) took place during March, and the least (6.7%) in August.
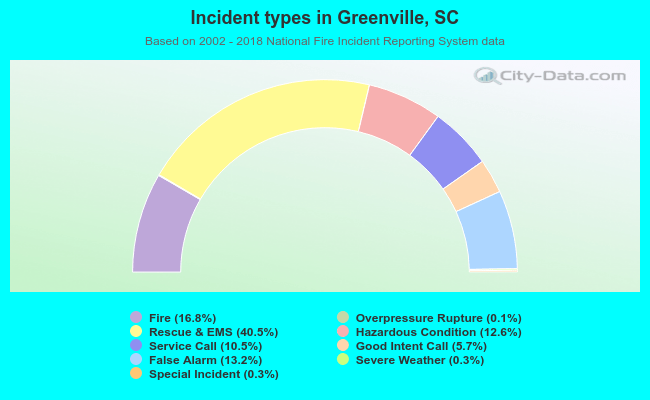 Out of all 91,853 cases reported during the years 2002 - 2018, the most belonged to the categories: Rescue & EMS (40.5%), Fire (16.8%), and False Alarm (13.2%).
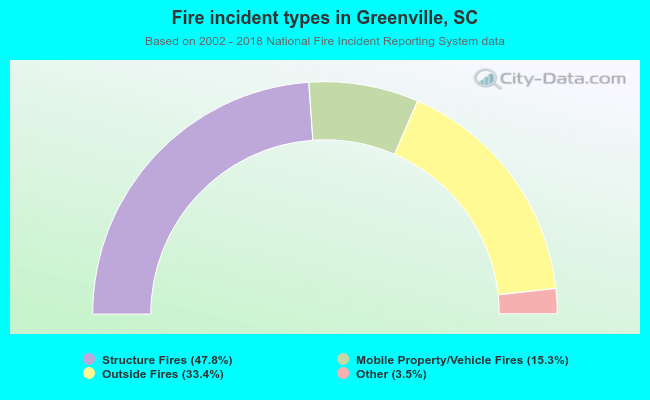 When looking into fire subcategories, the most reports belonged to: Structure Fires (47.8%), and Outside Fires (33.4%).