Greenville: Fire Incidents, Florida (FL)
Where are fire incidents reported in Greenville, FL
Something went wrong! Please refresh the page.
|
| |||||||||||||||||||||||||||||||||||||||||||||||||||||||||||||||||||||||||||||||||||||||||||||||||||||||||||||
| Other | 139 | |||||||||||||||||||||||||||||||||||||||||||||||||||||||||||||||||||||||||||||||||||||||||||||||||||||||||||||
2003 - 2018 National Fire Incident Reporting System (NFIRS) incidents
- Incident types reported to NFIRS in Greenville, FL
- 48143.2%Fire
- 28425.5%Rescue & EMS
- 20018.0%Hazardous Condition
- 877.8%Good Intent Call
- 292.6%False Alarm
- 161.4%Service Call
- 121.1%Severe Weather
- 20.2%Overpressure Rupture
- 20.2%Special Incident
- Fire incident types reported to NFIRS in Greenville, FL
- 20342.2%Outside Fires
- 18538.5%Structure Fires
- 8317.3%Mobile Property/Vehicle Fires
- 102.1%Other
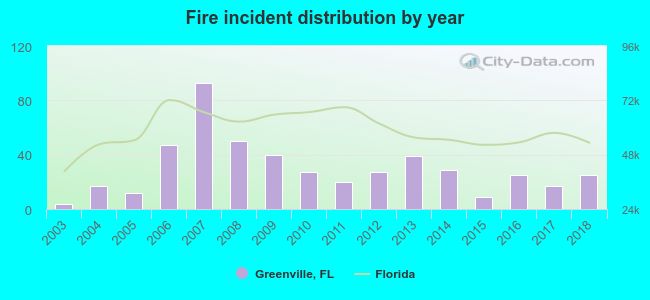 According to the data from the years 2003 - 2018 the average number of fires per year is 30. The highest number of fire incidents - 93 took place in 2007, and the least - 4 in 2003. The data has a growing trend.
 24.3% incidents where reported in the morning and 75.7% in the evening. The most fires (21.2%) took place on Saturday, and the least (10.4%) on Wednesday.
 Based on the 481 incident reports from years 2003 - 2018 most fires (13.1%) took place during March, and the least (4.2%) in July.
 Out of all 1,113 cases reported during the years 2003 - 2018, the most belonged to the categories: Fire (43.2%), Rescue & EMS (25.5%), and Hazardous Condition (18.0%).
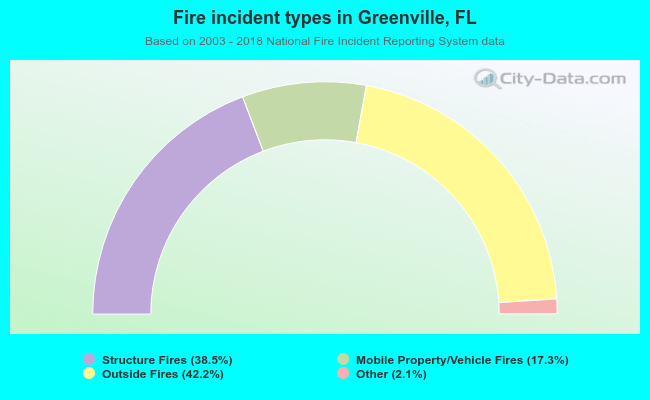 When looking into fire subcategories, the most incidents belonged to: Outside Fires (42.2%), and Structure Fires (38.5%).