| Fire incidents reported |
|---|
| Sreet name | Count |
|---|
| 70 HWY | 12 | | ELIZABETH ST | 12 | | CLARK ST | 8 | | CUMBERLAND ST | 8 | | CO RD 2000 E | 6 | | HAUGHTON HWY | 6 | | I70 WB | 6 | | MILL ST | 6 | | 130 HWY | 4 | | 208 IL RT 130 | 4 | | 306 MILL ST | 4 | | 404 EAST ELIZABETH ST | 4 | | CINCINNATI | 4 | | CO RD 1800 E | 4 | | CR 2200 EAST 500 NORTH | 4 | | CR 350 | 4 | | CUMBERLAND | 4 | | CUMBERLAND RD | 4 | | I70 LGTS | 4 | | ILLINOIS | 4 | | PLEASANT | 4 | | RT 40 | 4 | | 100 JAY HAYEN DRIVE | 2 | | 100 W ILLINOIS | 2 | | 102 GRADE SCHOOL DRIVE | 2 |
| | | Fire incidents reported |
|---|
| Sreet name | Count |
|---|
| 102 N HAUGHTON DRIVE | 2 | | 1037 CO RD 1850 E | 2 | | 106 N CLARK ST | 2 | | 106 NORTH CLARK | 2 | | 107 NORTH MILL | 2 | | 111 PLEASANT ST | 2 | | 119 SOUTH KENTUCKY ST | 2 | | 1232 CO RD 1900 E. | 2 | | 1235 I70 WEST BOUND | 2 | | 130 AND RT 40 | 2 | | 135 CR 1600 E | 2 | | 1350 E | 2 | | 1393 CO ROAD 125N | 2 | | 1467 CO RD 200 N | 2 | | 1467 CORD 200 N | 2 | | 1500 E 200 N | 2 | | 1565 CO RD 350 NORTH | 2 | | 1567 CO RD 350 NORTH | 2 | | 1575 CO RD 1200 N | 2 | | 1612 CO RD 650 NORTH RD | 2 | | 1625 E 1325 NORTH | 2 | | 1654 CO RD 350 N | 2 | | 1675 E COUNTY ROAD 1200N | 2 | | 1688 CO. RD. 200N. | 2 | | |
|
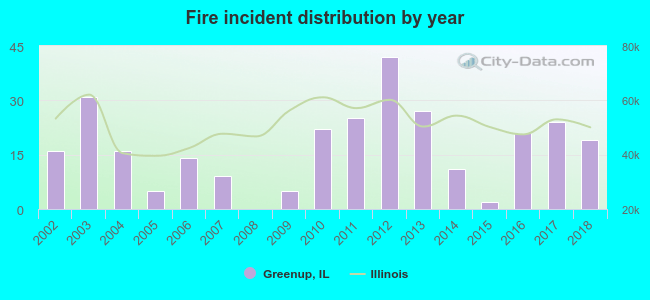 Based on the data from the years 2002 - 2018 the average number of fire incidents per year is 17. The highest number of reported fires - 42 took place in 2012, and the least - 0 in 2008. The data has an increasing trend.
 35.3% incidents where reported in the morning and 64.7% in the evening. The most fires (16.6%) took place on Monday, and the least (11.1%) on Wednesday.
 Based on the 289 fire incident reports from years 2002 - 2018 most fires (12.5%) took place during April, and the least (4.2%) in January.
 Out of all 510 cases reported during the years 2002 - 2018, the most belonged to the categories: Fire (56.7%), Rescue & EMS (25.9%), and Hazardous Condition (7.1%).
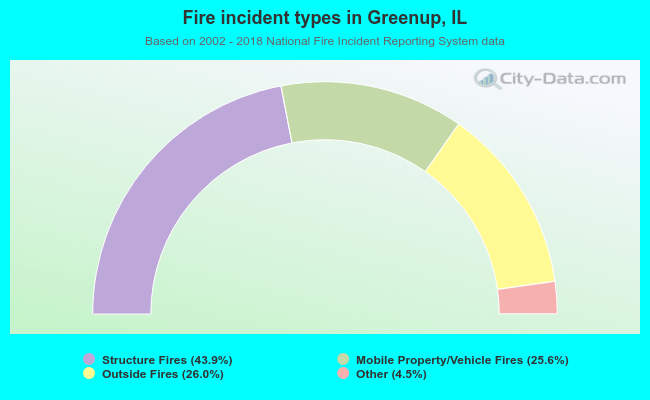 When looking into fire subcategories, the most reports belonged to: Structure Fires (43.9%), and Outside Fires (26.0%).