Green Bay: Fire Incidents, Wisconsin (WI)
Where are fire incidents reported in Green Bay, WI
Something went wrong! Please refresh the page.
| Fire incidents reported | |
|---|---|
| Sreet name | Count |
| EASTMAN AVE | 614 |
| MASON ST | 314 |
| MAIN ST | 218 |
| VELP AVE | 176 |
| SHAWANO AVE | 154 |
| BROADWAY ST | 148 |
| WALNUT ST | 122 |
| DOUSMAN ST | 110 |
| EASTMAN AV | 110 |
| UNIVERSITY AVE | 110 |
| WESTERN AVE | 108 |
| LOMBARDI AVE | 106 |
| HUMBOLDT RD | 100 |
| WEBSTER AVE | 98 |
| MILITARY AVE | 90 |
| 9TH ST | 88 |
| LIME KILN RD | 84 |
| FISK ST | 82 |
| TAYLOR ST | 78 |
| DAY ST | 76 |
| CHERRY ST | 72 |
| AUGUST ST | 66 |
| I-43 | 66 |
| WESTERN AV | 66 |
| VAN BUREN ST | 64 |
| DECKNER AVE | 60 |
| QUINCY ST | 60 |
| ASHLAND AVE | 58 |
| MEMORIAL DR | 58 |
| ADAMS ST | 56 |
| Other | 2,232 |
2002 - 2018 National Fire Incident Reporting System (NFIRS) incidents
- Incident types reported to NFIRS in Green Bay, WI
- 42,02162.0%Rescue & EMS
- 5,8448.6%Fire
- 5,5548.2%Service Call
- 5,3527.9%Good Intent Call
- 5,2717.8%Hazardous Condition
- 2,8404.2%False Alarm
- 7801.2%Special Incident
- 680.1%Overpressure Rupture
- Fire incident types reported to NFIRS in Green Bay, WI
- 2,95350.5%Structure Fires
- 1,48825.5%Outside Fires
- 97516.7%Mobile Property/Vehicle Fires
- 4287.3%Other
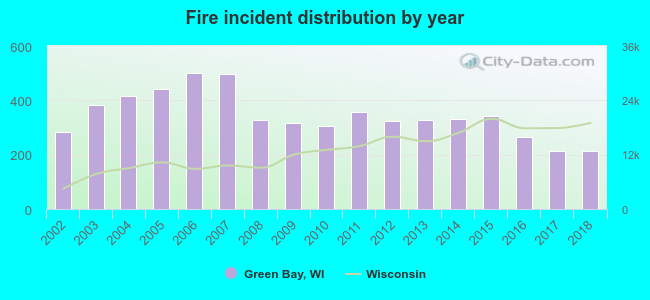 According to the data from the years 2002 - 2018 the average number of fires per year is 344. The highest number of fires - 499 took place in 2006, and the least - 214 in 2017. The data has a decreasing trend.
The average number of yearly fire incidents per 10k residents in Green Bay, WI compared to nearest cities:
(Note: Based on data for the last 3 years, including only cities with population 5,000 and above)
| Green Bay: | 22.1 |
| Allouez: | 0.7 |
| Ashwaubenon: | 9.0 |
| Bellevue: | 27.8 |
| Howard: | 11.4 |
| De Pere: | 19.3 |
| Hobart: | 5.1 |
| Ledgeview: | 4.6 |
| Suamico: | 9.5 |
 The median response time based on all reported fire incidents is 5 minutes. This is lower than the state median value.
 Based on the data from the years 2002 - 2018 the average number of fire-related yearly deaths is 1. The highest number of reported deaths - 4 took place in 2003, and the lowest - 0 in 2004. The data has a dropping trend.
The average number of fatalities per 1,000 fire incidents is 3. This indicator was the highest - 11 in 2002, and the lowest 0 in 2004. The trend for fatalities per 1,000 incidents is dropping. Compared to the state value the number of deaths per 1,000 fires is higher.
Based on the data from the years 2002 - 2018 the average number of fire-related yearly deaths is 1. The highest number of reported deaths - 4 took place in 2003, and the lowest - 0 in 2004. The data has a dropping trend.
The average number of fatalities per 1,000 fire incidents is 3. This indicator was the highest - 11 in 2002, and the lowest 0 in 2004. The trend for fatalities per 1,000 incidents is dropping. Compared to the state value the number of deaths per 1,000 fires is higher.Deaths per 1,000 incidents in Green Bay, WI compared to nearest cities:
(Note: Based on data for all years, including only cities with at least 2,500 fire incidents)
| Green Bay: | 2.7 |
 Based on the data from the years 2002 - 2018 the average number of fire-related casualties per year is 9. The highest number of casualties - 18 took place in 2018, and the lowest - 3 in 2002. The data has an increasing trend.
The average number of injuries per 1,000 fire incidents is 27. This indicator was the highest - 84 in 2018, and the lowest 9 in 2008. The trend for casualties per 1,000 fire incidents is growing. Compared to the state value the number of injuries per 1,000 fire incidents is much higher.
Based on the data from the years 2002 - 2018 the average number of fire-related casualties per year is 9. The highest number of casualties - 18 took place in 2018, and the lowest - 3 in 2002. The data has an increasing trend.
The average number of injuries per 1,000 fire incidents is 27. This indicator was the highest - 84 in 2018, and the lowest 9 in 2008. The trend for casualties per 1,000 fire incidents is growing. Compared to the state value the number of injuries per 1,000 fire incidents is much higher.
 31.9% incidents where reported in the morning and 68.1% in the evening. The most fires (16.5%) took place on Sunday, and the least (12.8%) on Wednesday.
 According to the 5,844 incident reports from years 2002 - 2018 most fires (10.3%) took place during July, and the least (6.3%) in February.
 Out of all 67,754 cases reported during the years 2002 - 2018, the most belonged to the categories: Rescue & EMS (62.0%), Fire (8.6%), and Service Call (8.2%).
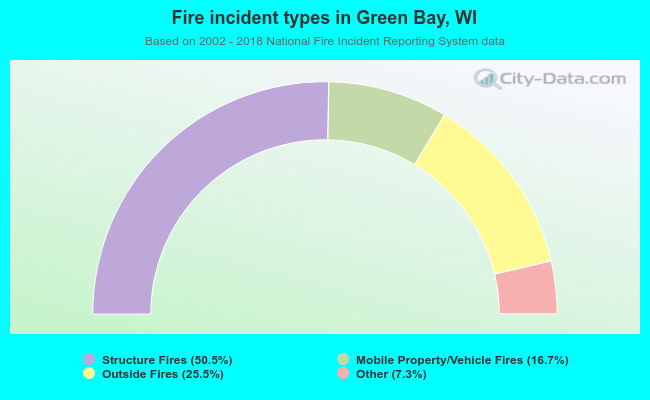 When looking into fire subcategories, the most reports belonged to: Structure Fires (50.5%), and Outside Fires (25.5%).