Greeleyville: Fire Incidents, South Carolina (SC)
Where are fire incidents reported in Greeleyville, SC
Something went wrong! Please refresh the page.
|
| |||||||||||||||||||||||||||||||||||||||||||||||||||||||||||||||||||||||||||||||||||||||||||||||||||||||||||||
| Other | 3 | |||||||||||||||||||||||||||||||||||||||||||||||||||||||||||||||||||||||||||||||||||||||||||||||||||||||||||||
2004 - 2018 National Fire Incident Reporting System (NFIRS) incidents
- Incident types reported to NFIRS in Greeleyville, SC
- 32346.9%Fire
- 18627.0%Rescue & EMS
- 8211.9%Hazardous Condition
- 456.5%Good Intent Call
- 385.5%False Alarm
- 71.0%Service Call
- 40.6%Severe Weather
- 30.4%Special Incident
- 10.1%Overpressure Rupture
- Fire incident types reported to NFIRS in Greeleyville, SC
- 18256.3%Outside Fires
- 6720.7%Mobile Property/Vehicle Fires
- 5918.3%Structure Fires
- 154.6%Other
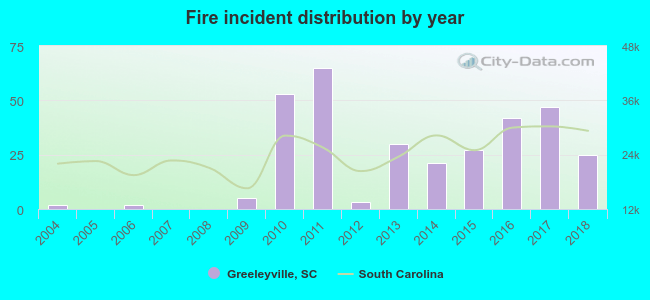 Based on the data from the years 2004 - 2018 the average number of fire incidents per year is 21. The highest number of reported fire incidents - 65 took place in 2011, and the least - 0 in 2005. The data has an increasing trend.
 21.1% incidents where reported in the morning and 78.9% in the evening. The most fires (18.3%) took place on Saturday, and the least (11.1%) on Sunday.
 According to the 323 incident reports from years 2004 - 2018 most fires (20.7%) took place during March, and the least (4.0%) in October.
 Out of all 689 cases reported during the years 2004 - 2018, the most belonged to the categories: Fire (46.9%), Rescue & EMS (27.0%), and Hazardous Condition (11.9%).
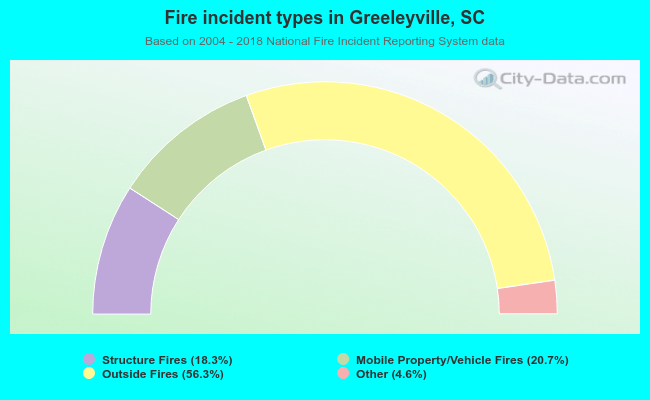 When looking into fire subcategories, the most incidents belonged to: Outside Fires (56.3%), and Mobile Property/Vehicle Fires (20.7%).