| Fire incidents reported |
|---|
| Sreet name | Count |
|---|
| INTERSTATE 64 | 20 | | ROUTE 1 | 14 | | I64 | 12 | | MAIN ST | 12 | | R R 1 | 12 | | 2ND ST | 10 | | RR 1 | 10 | | ROUTE 130 | 8 | | CO RD 2400 N | 6 | | COURT ST | 6 | | MILL ST | 6 | | WABASH RIVER BOTTOMS | 6 | | 624 W SPRING ST | 4 | | CO RD 2400 | 4 | | COUNTY LINE ROAD | 4 | | NORTH MAIN STREET | 4 | | SOUTH WATER STREET | 4 | | SPRING ST | 4 | | WATER STREET | 4 | | CO RD N | 2 | | 1-64 126 MP W BOUND | 2 | | 1042 IL RTE 1 | 2 | | 1042 ROUTE 1 | 2 | | 1075E AND 2400 N | 2 | | 109 SOUTH SECOND STREET | 2 |
| | | Fire incidents reported |
|---|
| Sreet name | Count |
|---|
| 121 MM I64 WB | 2 | | 121 MM WB I64 | 2 | | 121 MM WESTBOUND I64 | 2 | | 122 E MILL | 2 | | 122 SOUTH COURT | 2 | | 126 E FAIR ST | 2 | | 131 EAST SPRING ST | 2 | | 173 CO RD 300 E | 2 | | 180 CO. RD | 2 | | 1ST ST | 2 | | 2 MI N ON OLD HIGHHWAY 130 | 2 | | 2000 E | 2 | | 202 NORTH STATE ROAD | 2 | | 2060 CO. ROAD 2450 N | 2 | | 2140 EAST | 2 | | 221 NORTH SHORT STREET | 2 | | 222 NORTH 2ND STREET | 2 | | 222 WEST MARTIN ST | 2 | | 222 WEST MARTIN STREET | 2 | | 2379 IL ROUTE 1 | 2 | | 2400 CO RD E | 2 | | 2450 N 2125 E | 2 | | 2484CORD1625 E RD | 2 | | 2539 COUNTY ROAD 1475 E | 2 | | |
|
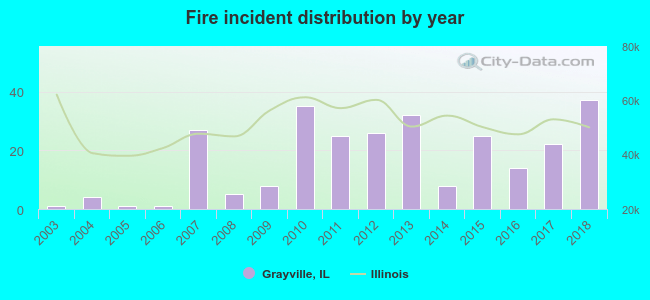 Based on the data from the years 2003 - 2018 the average number of fire incidents per year is 17. The highest number of reported fires - 37 took place in 2018, and the least - 1 in 2003. The data has an increasing trend.
 29.2% incidents where reported in the morning and 70.8% in the evening. The most fires (17.7%) took place on Thursday, and the least (10.3%) on Sunday.
 Based on the 271 fire incident reports from years 2003 - 2018 most fires (11.4%) took place during May, and the least (4.1%) in December.
 Out of all 458 cases reported during the years 2003 - 2018, the most belonged to the categories: Fire (59.2%), Rescue & EMS (15.1%), and Good Intent Call (8.5%).
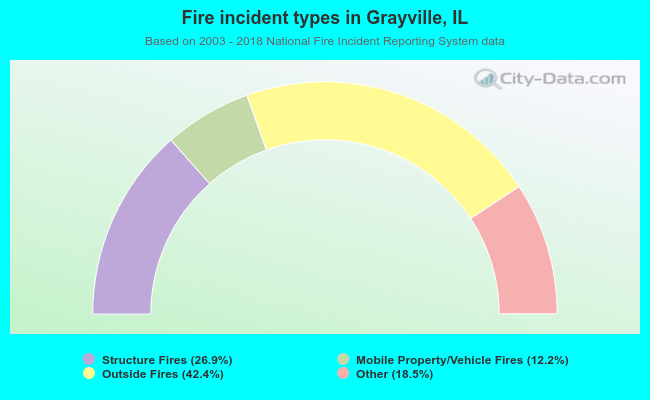 When looking into fire subcategories, the most reports belonged to: Outside Fires (42.4%), and Structure Fires (26.9%).