| Fire incidents reported |
|---|
| Sreet name | Count |
|---|
| BUSBY ROAD | 8 | | BERRY RD | 6 | | HWY 126 E | 6 | | HWY 126 WEST | 6 | | MORAN RD | 6 | | 1173 PARKER ROAD | 4 | | 126 PINE TERRACE LN | 4 | | 1327 WATERBIND ROAD | 4 | | 1376 WATERBIND RD | 4 | | 1376 WATERBIND ROAD | 4 | | 165 HWY | 4 | | HARRIS ROAD | 4 | | HONEYCUT ROAD | 4 | | HWY 850 HWY | 4 | | MIXON LN | 4 | | PARKER ROAD | 4 | | 8939 HWY 165 | 2 | | 100 SANFORD RD | 2 | | 1055 HWY 3239 HWY | 2 | | 10898 HWY 126 | 2 | | 112 BATSON LN | 2 | | 11521 HWY. 126 WEST | 2 | | 120 BUSBY ROAD | 2 | | 120 WYLES ROAD | 2 | | 1201 BERRY ROAD | 2 |
| | | Fire incidents reported |
|---|
| Sreet name | Count |
|---|
| 124 SUNSHINE RD | 2 | | 126 E | 2 | | 126 PINE TERRACE LANE | 2 | | 1336 WATERBIND RD | 2 | | 141 HILLSTEAD LANE | 2 | | 1553HWY 850 | 2 | | 1588 WATERBIND ROAD | 2 | | 165 STEWART ROAD | 2 | | 1664 WYLES ROAD | 2 | | 172 VOLENTINE RD | 2 | | 172 VOLENTINE ROAD | 2 | | 173 RICHARDSON DRIVE | 2 | | 176 CEDAR GROVE CHURCH ROAD | 2 | | 177 MARION PLACE | 2 | | 185 THOMPSON DRIV | 2 | | 196 BILLIE LANE | 2 | | 197 FOY LN | 2 | | 205 BYRD DRIVE | 2 | | 209 LEROY RD | 2 | | 220 SHUMARD TRAIL | 2 | | 223 GAIL LANE | 2 | | 223 GOLDWING LN | 2 | | 288 CRAIN ROAD | 2 | | 301 PARAIRIE RD | 2 | | 3050 HWY 850 | 2 |
|
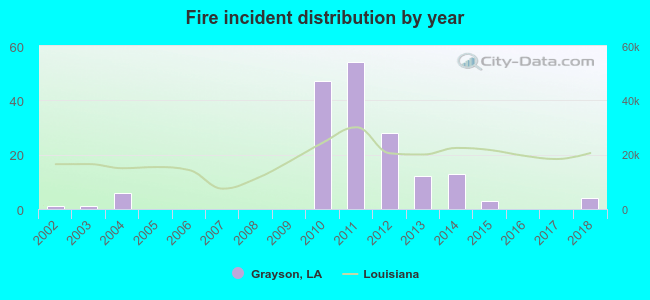 Based on the data from the years 2002 - 2018 the average number of fire incidents per year is 10. The highest number of fire incidents - 54 took place in 2011, and the least - 0 in 2005. The data has an increasing trend.
 27.2% incidents where reported in the morning and 72.8% in the evening. The most fires (17.8%) took place on Saturday, and the least (10.1%) on Tuesday.
 Based on the 169 fire incidents from years 2002 - 2018 most fires (23.1%) took place during March, and the least (3.6%) in November.
 Out of all 192 cases reported during the years 2002 - 2018, the most belonged to the categories: Fire (88.0%), Rescue & EMS (6.3%), and Service Call (2.1%).
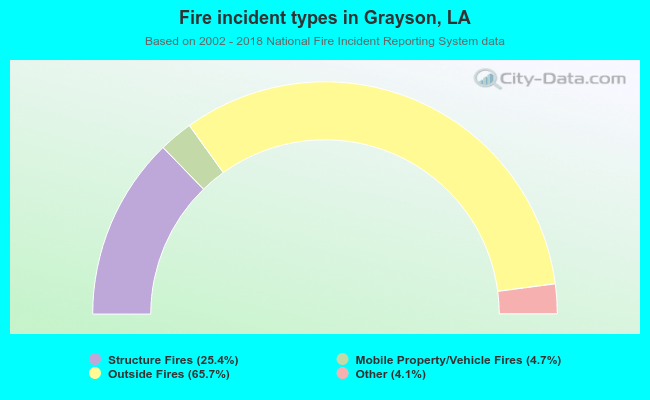 When looking into fire subcategories, the most reports belonged to: Outside Fires (65.7%), and Structure Fires (25.4%).