| Fire incidents reported |
|---|
| Sreet name | Count |
|---|
| GREENHOUSE AVE | 18 | | ROUTE 89 HWY | 18 | | IL HWY 89 | 10 | | 1100TH AVE | 8 | | 1250TH AVE | 8 | | GRANT ST | 8 | | IL HWY 71 | 8 | | MAIN ST | 8 | | 850TH AVE | 6 | | BOTTOM RD | 6 | | HAWTHORNE | 6 | | ILLINOIS HWY 89 HWY | 6 | | MCCOY ST | 6 | | MERIDIAN RD | 6 | | ROUTE 71 | 6 | | 1100TH ST | 4 | | 1150TH | 4 | | 1150TH AVE | 4 | | 950TH AVE | 4 | | BOTTOM RD RD | 4 | | CLEVELAND CIR | 4 | | DIVISION EXT | 4 | | DIVISION ST. EXT. | 4 | | IL HWY 89 HWY | 4 | | TOMLINSON | 4 |
| | | Fire incidents reported |
|---|
| Sreet name | Count |
|---|
| TOMLINSON ST ST | 4 | | 101 SOUTH HIGH STREET | 2 | | 102 HIGH | 2 | | 10395 1150TH AVENUE | 2 | | 104 S HIGH STREET | 2 | | 1050 AVE | 2 | | 1050 E RT 71 | 2 | | 1100 | 2 | | 1100 AVE | 2 | | 110TH AVE | 2 | | 11173 N 100TH AVE | 2 | | 11916 H 700TH AVE | 2 | | 1250 | 2 | | 1250TH ST | 2 | | 128 CLEVELAND CIRCLE | 2 | | 1300 E | 2 | | 1300TH ST | 2 | | 13071 HWY 89 | 2 | | 13403 N 1250TH ROAD | 2 | | 13439 W BOTTOM ROAD | 2 | | 1375 ABE DRIVE | 2 | | 13895 BOTTOM ROAD | 2 | | 15421 E 1500TH | 2 | | 1545TH ST | 2 | | |
|
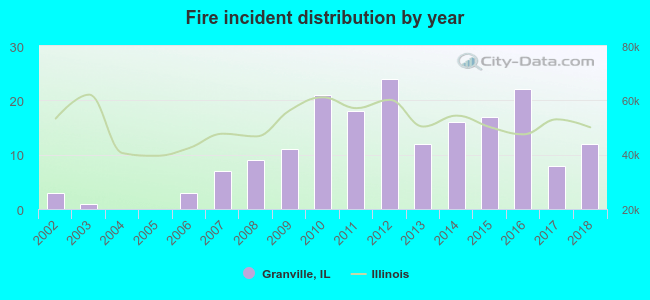 According to the data from the years 2002 - 2018 the average number of fires per year is 11. The highest number of reported fires - 24 took place in 2012, and the least - 0 in 2004. The data has a rising trend.
 33.2% incidents where reported in the morning and 66.8% in the evening. The most fires (21.7%) took place on Monday, and the least (10.3%) on Friday.
 Based on the 184 reports from years 2002 - 2018 most fires (21.7%) took place during April, and the least (2.7%) in August.
 Out of all 824 cases reported during the years 2002 - 2018, the most belonged to the categories: Rescue & EMS (62.9%), Fire (22.3%), and Hazardous Condition (9.8%).
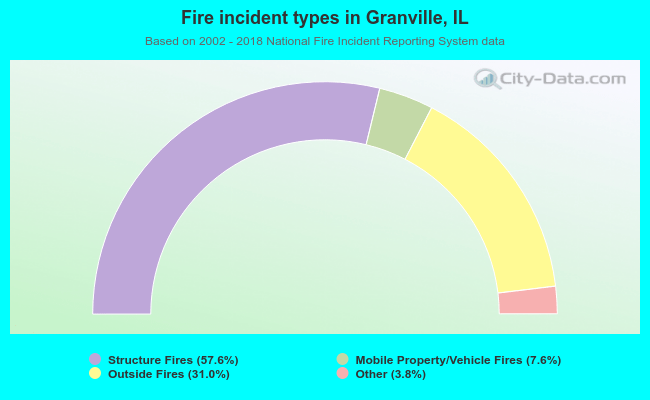 When looking into fire subcategories, the most reports belonged to: Structure Fires (57.6%), and Outside Fires (31.0%).