| Fire incidents reported |
|---|
| Sreet name | Count |
|---|
| I68 | 40 | | NATIONAL PIKE | 40 | | CHESTNUT RIDGE ROAD | 20 | | CHESTNUT RIDGE RD | 12 | | NEW GERMANY ROAD | 12 | | HARE HOLLOW RD | 8 | | I-68 24 MM | 8 | | ROUTE 40 | 8 | | SHADE HOLLOW RD | 8 | | HARE HOLLOW ROAD | 6 | | I-68 15 MM | 6 | | I-68 21 MILE MARKER | 6 | | I-68 24 MILE MARKER | 6 | | I68 14 MM | 6 | | I68 14MM | 6 | | I68 22 MM | 6 | | LOWER NEW GERMANY RD | 6 | | MAIN STREET | 6 | | POSEY ROW ROAD | 6 | | SPRINGS ROAD | 6 | | 14500 NATIONAL PIKE | 4 | | 2922 LOWER NEW GERMANY RD | 4 | | 3000 CHESTNUT RIDGE RD | 4 | | 575 PLATTER ROAD | 4 | | BLACKBERRY LANE | 4 |
| | | Fire incidents reported |
|---|
| Sreet name | Count |
|---|
| CHESTNUT RIDGE RD | 4 | | CHESTNUT RIDGE RD. | 4 | | HILL STREET | 4 | | I-68 14MM | 4 | | I-68 18 MM | 4 | | I68 10 MM | 4 | | I68 11 MM | 4 | | I68 13 MM | 4 | | I68 17 MM | 4 | | I68 19 MM | 4 | | JENNINGS ROAD | 4 | | KEYSERS RIDGE | 4 | | NEW GERMANY RD | 4 | | NEW GERMANY RD. | 4 | | PLATTER ROAD | 4 | | SAVAGE RIVER RD | 4 | | SAVAGE RIVER ROAD | 4 | | SPRINGS RD | 4 | | US 40 | 4 | | 103 MAIN ST | 2 | | 10306 NATIONAL PIKE | 2 | | 10515 NEW GERMANY ROAD | 2 | | 1054 PEA RIDGE RD | 2 | | 1078 JENNINGS RD | 2 | | |
|
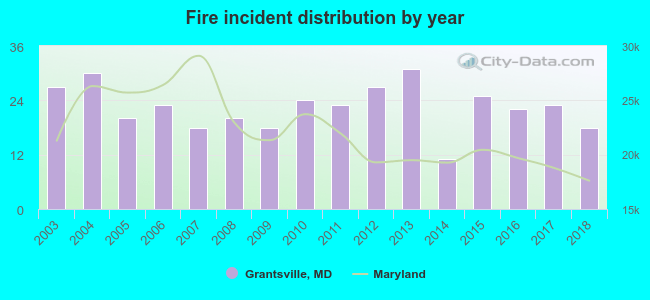 Based on the data from the years 2003 - 2018 the average number of fires per year is 23. The highest number of fires - 31 took place in 2013, and the least - 11 in 2014. The data has a dropping trend.
 31.9% incidents where reported in the morning and 68.1% in the evening. The most fires (17.8%) took place on Saturday, and the least (10.8%) on Sunday.
 According to the 360 incident reports from years 2003 - 2018 most fires (12.5%) took place during April, and the least (5.0%) in August.
 Out of all 1,281 cases reported during the years 2003 - 2018, the most belonged to the categories: Rescue & EMS (33.1%), Fire (28.1%), and Hazardous Condition (21.5%).
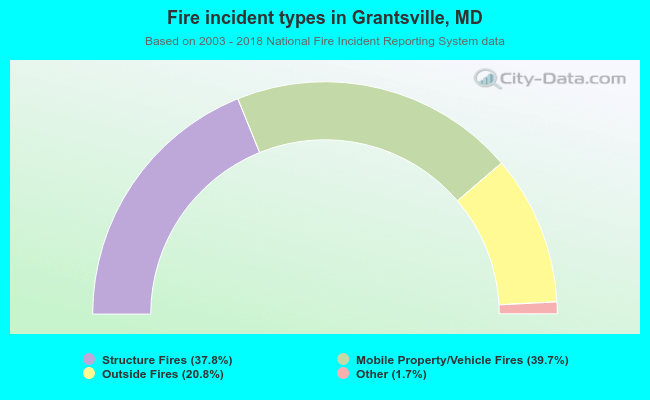 When looking into fire subcategories, the most reports belonged to: Mobile Property/Vehicle Fires (39.7%), and Structure Fires (37.8%).