Grantsburg: Fire Incidents, Wisconsin (WI)
Where are fire incidents reported in Grantsburg, WI
Something went wrong! Please refresh the page.
|
| |||||||||||||||||||||||||||||||||||||||||||||||||||||||||||||||||||||||||||||||||||||||||||||||||||||||||||||
2002 - 2018 National Fire Incident Reporting System (NFIRS) incidents
- Incident types reported to NFIRS in Grantsburg, WI
- 40154.0%Fire
- 11415.4%Rescue & EMS
- 8711.7%Hazardous Condition
- 729.7%Good Intent Call
- 304.0%Service Call
- 243.2%False Alarm
- 131.8%Special Incident
- 10.1%Overpressure Rupture
- Fire incident types reported to NFIRS in Grantsburg, WI
- 20851.9%Structure Fires
- 13934.7%Outside Fires
- 4511.2%Mobile Property/Vehicle Fires
- 92.2%Other
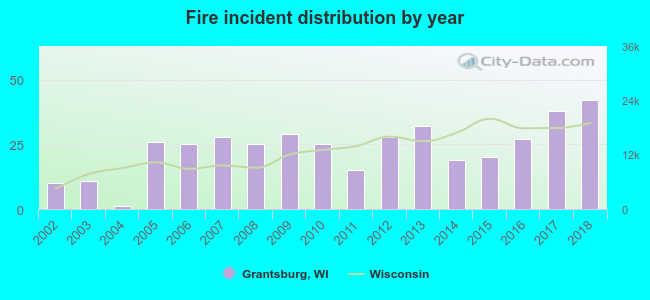 According to the data from the years 2002 - 2018 the average number of fires per year is 24. The highest number of fires - 42 took place in 2018, and the least - 1 in 2004. The data has an increasing trend.
 According to the data from the years 2002 - 2018 the average number of fire-related casualties per year is 0. The highest number of reported casualties - 3 took place in 2007, and the lowest - 0 in 2002. The data has a constant trend.
 33.9% incidents where reported in the morning and 66.1% in the evening. The most fires (21.4%) took place on Saturday, and the least (11.7%) on Wednesday.
 According to the 401 fire incidents from years 2002 - 2018 most fires (17.5%) took place during April, and the least (5.5%) in June.
 Out of all 742 cases reported during the years 2002 - 2018, the most belonged to the categories: Fire (54.0%), Rescue & EMS (15.4%), and Hazardous Condition (11.7%).
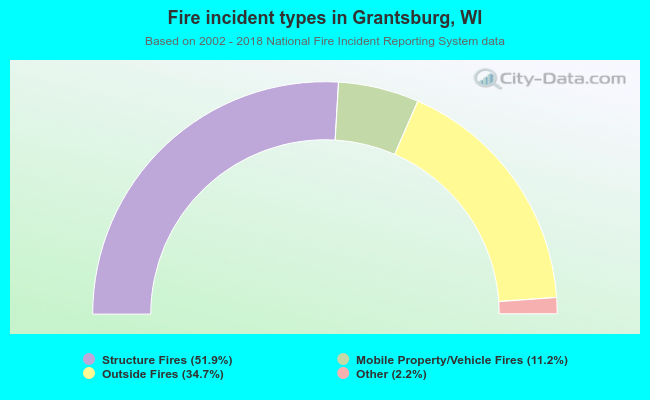 When looking into fire subcategories, the most incidents belonged to: Structure Fires (51.9%), and Outside Fires (34.7%).