Granby: Fire Incidents, Massachusetts (MA)
Where are fire incidents reported in Granby, MA
Something went wrong! Please refresh the page.
|
| |||||||||||||||||||||||||||||||||||||||||||||||||||||||||||||||||||||||||||||||||||||||||||||||||||||||||||||
2002 - 2018 National Fire Incident Reporting System (NFIRS) incidents
- Incident types reported to NFIRS in Granby, MA
- 41935.2%Fire
- 31526.4%Hazardous Condition
- 14612.2%Service Call
- 12610.6%False Alarm
- 1038.6%Good Intent Call
- 726.0%Rescue & EMS
- 40.3%Overpressure Rupture
- 40.3%Severe Weather
- 30.3%Special Incident
- Fire incident types reported to NFIRS in Granby, MA
- 18143.2%Structure Fires
- 17241.1%Outside Fires
- 4611.0%Mobile Property/Vehicle Fires
- 204.8%Other
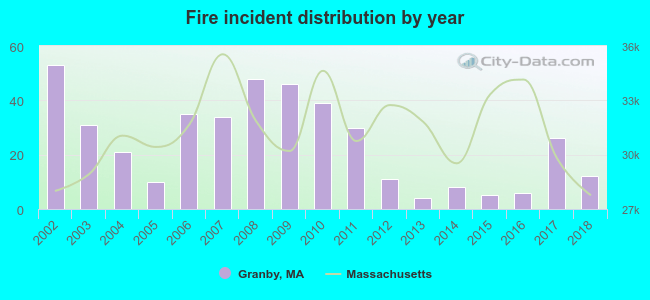 According to the data from the years 2002 - 2018 the average number of fire incidents per year is 25. The highest number of reported fire incidents - 53 took place in 2002, and the least - 4 in 2013. The data has a dropping trend.
 Based on the data from the years 2002 - 2018 the average number of fire-related yearly casualties is 0. The highest number of casualties - 1 took place in 2002, and the lowest - 0 in 2004. The data has a dropping trend.
 30.8% incidents where reported in the morning and 69.2% in the evening. The most fires (16.9%) took place on Saturday, and the least (12.6%) on Tuesday.
 According to the 419 fire incidents from years 2002 - 2018 most fires (22.7%) took place during April, and the least (4.8%) in August.
 Out of all 1,192 cases reported during the years 2002 - 2018, the most belonged to the categories: Fire (35.2%), Hazardous Condition (26.4%), and Service Call (12.2%).
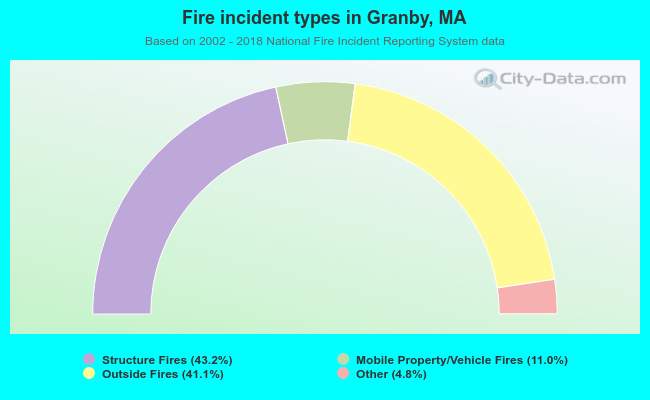 When looking into fire subcategories, the most reports belonged to: Structure Fires (43.2%), and Outside Fires (41.1%).