| Fire incidents reported |
|---|
| Sreet name | Count |
|---|
| MAIN ST | 16 | | MAIN STREET | 12 | | LEHIGH ROAD | 10 | | I380 NORTH | 6 | | MOUNTAINSIDE DR | 6 | | BLACKFOOT PATH | 4 | | CLIFTON BEACH ROAD | 4 | | NAVAJO PATH | 4 | | ROUTE 435 | 4 | | RT 435 | 4 | | SITTING BULL TRL | 4 | | AHWAHNEE TRL | 2 | | ARAPAHO TRAIL | 2 | | BLUE SKY PATH | 2 | | BREEZEWOOD ACRES | 2 | | BROKEN ARROW LN | 2 | | CAMPFIRE LANE | 2 | | CHIP PATH | 2 | | CHOCTAW TRAIL | 2 | | COOLBAUGH RD | 2 | | EAST CREEK VIEW | 2 | | ELIAS RD | 2 | | ELK ROAD | 2 | | EUCAS TRL | 2 | | FOREST LANE | 2 |
| | | Fire incidents reported |
|---|
| Sreet name | Count |
|---|
| GRAVITY AVE | 2 | | HALEIWA TRL | 2 | | I380 SOUTH | 2 | | INDIAN MAIDEN TRL | 2 | | INDIAN MAIDEN WAY | 2 | | IROQUOIS AVE | 2 | | JUBILEE ROAD | 2 | | LAKE DR | 2 | | LAKE DRIVE EAST | 2 | | LAKEVIEW TIMBERS DR | 2 | | MAURICE DRIVE | 2 | | MIAN STREET | 2 | | NAVAJO PATH | 2 | | NAVAJO TRL | 2 | | OCONEE TRL | 2 | | PACKANACK DRIVE | 2 | | PEACE PIPE WAY | 2 | | PERCH LN | 2 | | POCONO DRIVE | 2 | | POCONO MOBILE MANOR | 2 | | RAINBOW DRIVE | 2 | | RED WING PATH | 2 | | RIFLE RANGE ROAD | 2 | | RIVERFRONT WAY | 2 | | |
|
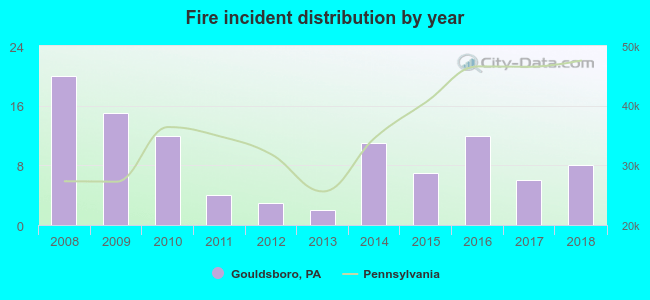 According to the data from the years 2008 - 2018 the average number of fires per year is 9. The highest number of fires - 20 took place in 2008, and the least - 2 in 2013. The data has a declining trend.
 34.0% incidents where reported in the morning and 66.0% in the evening. The most fires (21.0%) took place on Friday, and the least (8.0%) on Saturday.
 Based on the 100 fire incidents from years 2008 - 2018 most fires (20.0%) took place during April, and the least (4.0%) in May.
 Out of all 360 cases reported during the years 2008 - 2018, the most belonged to the categories: Fire (27.8%), Rescue & EMS (20.3%), and Overpressure Rupture (18.3%).
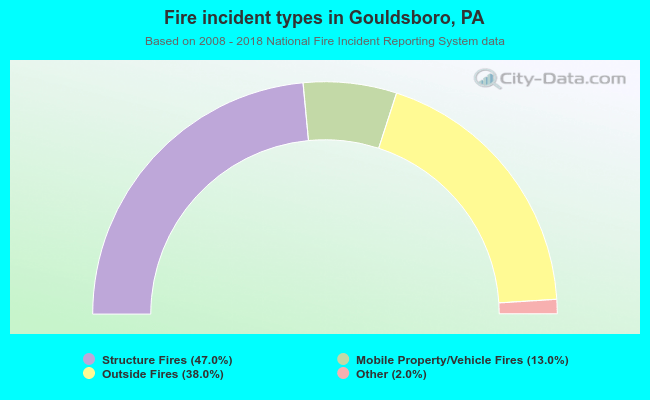 When looking into fire subcategories, the most incidents belonged to: Structure Fires (47.0%), and Outside Fires (38.0%).