Goshen: Fire Incidents, Indiana (IN)
Where are fire incidents reported in Goshen, IN
Something went wrong! Please refresh the page.
| Fire incidents reported | |
|---|---|
| Sreet name | Count |
| MAIN ST | 164 |
| LINCOLN AVE | 112 |
| ELKHART RD | 88 |
| LINCOLNWAY | 82 |
| 20 | 78 |
| 7TH ST | 74 |
| 10TH ST | 62 |
| 18 | 50 |
| SR 4 | 48 |
| 15 | 46 |
| KERCHER RD | 46 |
| 8TH ST | 44 |
| GREENCROFT DR | 44 |
| WILDEN AVE | 44 |
| S.R. 15 | 40 |
| CHICAGO AVE | 38 |
| CR 36 | 38 |
| CO.RD. 19 | 36 |
| COLLEGE AVE | 36 |
| CR 38 | 36 |
| INDIANA AVE | 36 |
| EISENHOWER | 34 |
| 19 | 32 |
| CR 40 | 32 |
| PIKE ST | 32 |
| 6TH ST | 30 |
| 27 | 28 |
| 5TH ST | 28 |
| CO.RD. 34 | 28 |
| CR 32 | 28 |
| Other | 1,106 |
2002 - 2018 National Fire Incident Reporting System (NFIRS) incidents
- Incident types reported to NFIRS in Goshen, IN
- 6,42152.1%Rescue & EMS
- 2,62021.3%Fire
- 1,54312.5%Hazardous Condition
- 7696.2%Good Intent Call
- 7436.0%False Alarm
- 1971.6%Service Call
- 190.2%Special Incident
- Fire incident types reported to NFIRS in Goshen, IN
- 1,07441.0%Structure Fires
- 1,05140.1%Outside Fires
- 35013.4%Mobile Property/Vehicle Fires
- 1455.5%Other
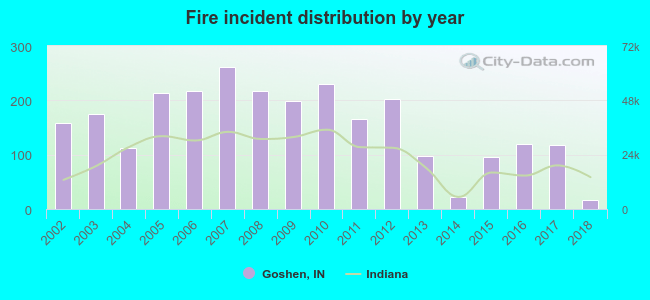 Based on the data from the years 2002 - 2018 the average number of fire incidents per year is 154. The highest number of fires - 261 took place in 2007, and the least - 16 in 2018. The data has a decreasing trend.
The average number of yearly fire incidents per 10k residents in Goshen, IN compared to nearest cities:
(Note: Based on data for the last 3 years, including only cities with population 5,000 and above)
| Goshen: | 26.1 |
| Elkhart: | 14.4 |
| Nappanee: | 37.2 |
| Mishawaka: | 21.9 |
| Granger: | 15.5 |
| Notre Dame: | 36.8 |
| South Bend: | 26.3 |
| Warsaw: | 55.3 |
| Plymouth: | 24.4 |
 The median response time based on all reported fire incidents is 6 minutes. This is similar to the Indiana median value.
The median response time in Goshen, IN compared to nearest cities:
(Note: Based on data for all years, including only cities with at least 500 fire incidents)
| Goshen: | 6 minutes |
| Middlebury: | 8 minutes |
| Elkhart: | 6 minutes |
| Syracuse: | 7 minutes |
| Nappanee: | 6 minutes |
| Osceola: | 9 minutes |
| Shipshewana: | 11 minutes |
| Ligonier: | 8 minutes |
| Mishawaka: | 5 minutes |
 According to the reports from the years 2002 - 2018 the average number of fire-related casualties per year is 1. The highest number of reported casualties - 4 took place in 2007, and the lowest - 0 in 2003. The data has a decreasing trend.
The average number of casualties per 1,000 fire incidents is 6. This indicator was the highest - 20 in 2013, and the lowest 0 in 2003. The trend for casualties per 1,000 fire incidents is declining. Compared to the state value the number of injuries per 1,000 fire incidents is similar.
According to the reports from the years 2002 - 2018 the average number of fire-related casualties per year is 1. The highest number of reported casualties - 4 took place in 2007, and the lowest - 0 in 2003. The data has a decreasing trend.
The average number of casualties per 1,000 fire incidents is 6. This indicator was the highest - 20 in 2013, and the lowest 0 in 2003. The trend for casualties per 1,000 fire incidents is declining. Compared to the state value the number of injuries per 1,000 fire incidents is similar.Casualties per 1,000 incidents in Goshen, IN compared to nearest cities:
(Note: Based on data for all years, including only cities with at least 500 fire incidents)
| Goshen: | 7.3 |
| Middlebury: | 7.9 |
| Elkhart: | 6.5 |
| Syracuse: | 4.9 |
| Nappanee: | 18.1 |
| Osceola: | 2.9 |
| Shipshewana: | 10.1 |
| Ligonier: | 8.5 |
| Mishawaka: | 11.4 |
 30.5% incidents where reported in the morning and 69.5% in the evening. The most fires (16.7%) took place on Saturday, and the least (12.7%) on Sunday.
 According to the 2,620 incident reports from years 2002 - 2018 most fires (11.7%) took place during April, and the least (6.0%) in December.
 Out of all 12,327 cases reported during the years 2002 - 2018, the most belonged to the categories: Rescue & EMS (52.1%), Fire (21.3%), and Hazardous Condition (12.5%).
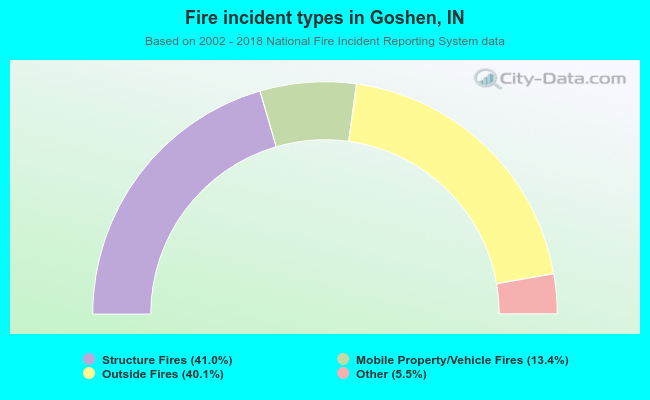 When looking into fire subcategories, the most reports belonged to: Structure Fires (41.0%), and Outside Fires (40.1%).