| Fire incidents reported |
|---|
| Sreet name | Count |
|---|
| I24 | 16 | | FRIENDSHIP LOOP | 12 | | INTERSTATE 24 | 12 | | EAGLE POINT BAY RD | 8 | | FLY AVE | 8 | | I57 | 8 | | LAKESHORE DR | 8 | | OLD MARION RD | 8 | | RT. 37 NORTH | 8 | | TUNNEL HILL RD | 8 | | FLY ST | 6 | | GOREVILLE RD | 6 | | HENDEE LN | 6 | | LICK CREEK RD | 6 | | MARTIN LN | 6 | | OAK CIR | 6 | | OLD MARION RD. | 6 | | PINES RD | 6 | | PULLEYS MILL RD | 6 | | ARROWHEAD DR | 4 | | BROADWAY | 4 | | DUTCHMAN LAKE RD | 4 | | EAGLE CLAW PT | 4 | | FOSSE WAY | 4 | | GORE CANYON RD | 4 |
| | | Fire incidents reported |
|---|
| Sreet name | Count |
|---|
| GOREVILLE RD. | 4 | | HAPPY HOLLOW RD | 4 | | HAPPY HOLLOW RD | 4 | | HICKORY DR | 4 | | HOLLAND LN | 4 | | I-24 | 4 | | I-57 | 4 | | INTERSTATE 57 | 4 | | MARTIN CAVE LN | 4 | | OLD MARION ROAD | 4 | | REGENT LN | 4 | | ROBIN WOODS LN | 4 | | ROUTE 37 | 4 | | RT 37 N | 4 | | RT 37 NORTH | 4 | | SOUTH BROADWAY | 4 | | STATE ROUTE 37 | 4 | | STATE RT. 37 NORTH | 4 | | SUNSET LN | 4 | | THUNDERHEAD DR | 4 | | VAIL LN | 4 | | WOLF CREEK RD | 4 | | 111 TRAIL RIDGE ROAD | 2 | | 116 E MAIN STREET | 2 | | |
|
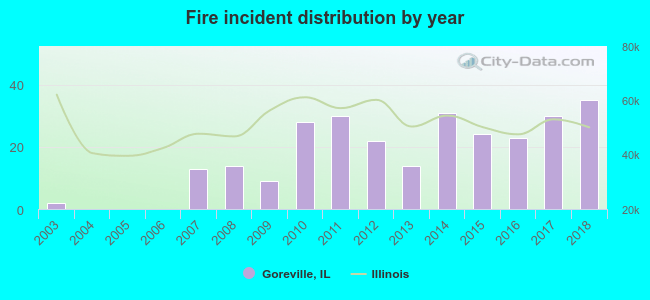 According to the data from the years 2003 - 2018 the average number of fires per year is 17. The highest number of reported fires - 35 took place in 2018, and the least - 0 in 2004. The data has a rising trend.
 31.3% incidents where reported in the morning and 68.7% in the evening. The most fires (18.2%) took place on Friday, and the least (8.4%) on Wednesday.
 Based on the 275 reports from years 2003 - 2018 most fires (15.6%) took place during March, and the least (3.6%) in June.
 Out of all 829 cases reported during the years 2003 - 2018, the most belonged to the categories: Overpressure Rupture (52.2%), Fire (33.2%), and Service Call (5.7%).
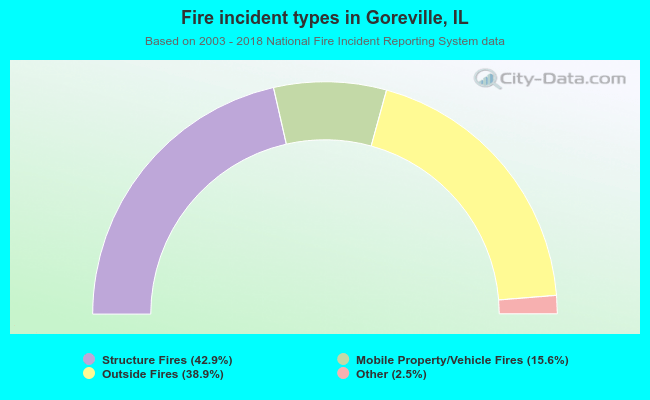 When looking into fire subcategories, the most reports belonged to: Structure Fires (42.9%), and Outside Fires (38.9%).