Gobles: Fire Incidents, Michigan (MI)
Where are fire incidents reported in Gobles, MI
Something went wrong! Please refresh the page.
|
| |||||||||||||||||||||||||||||||||||||||||||||||||||||||||||||||||||||||||||||||||||||||||||||||||||||||||||||
2002 - 2018 National Fire Incident Reporting System (NFIRS) incidents
- Incident types reported to NFIRS in Gobles, MI
- 31141.6%Fire
- 20126.9%Hazardous Condition
- 9012.0%Good Intent Call
- 8211.0%Rescue & EMS
- 395.2%Service Call
- 222.9%False Alarm
- 20.3%Special Incident
- Fire incident types reported to NFIRS in Gobles, MI
- 14646.9%Structure Fires
- 11737.6%Outside Fires
- 4012.9%Mobile Property/Vehicle Fires
- 82.6%Other
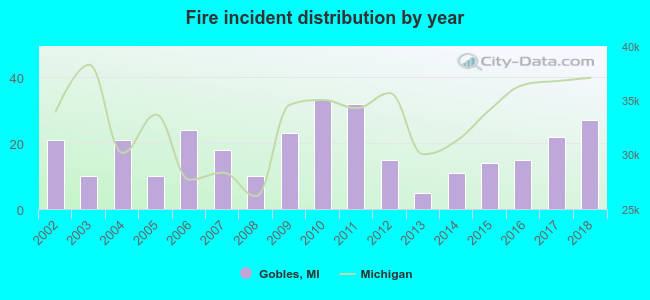 Based on the data from the years 2002 - 2018 the average number of fire incidents per year is 18. The highest number of fire incidents - 33 took place in 2010, and the least - 5 in 2013. The data has a growing trend.
 28.3% incidents where reported in the morning and 71.7% in the evening. The most fires (15.8%) took place on Monday, and the least (12.2%) on Tuesday.
 Based on the 311 incident reports from years 2002 - 2018 most fires (18.6%) took place during April, and the least (3.2%) in January.
 Out of all 747 cases reported during the years 2002 - 2018, the most belonged to the categories: Fire (41.6%), Rescue & EMS (26.9%), and Service Call (12.0%).
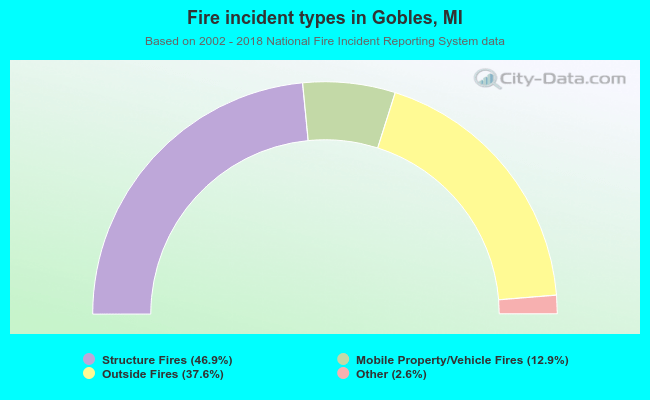 When looking into fire subcategories, the most reports belonged to: Structure Fires (46.9%), and Outside Fires (37.6%).