Glenwood: Fire Incidents, Minnesota (MN)
Where are fire incidents reported in Glenwood, MN
Something went wrong! Please refresh the page.
|
| |||||||||||||||||||||||||||||||||||||||||||||||||||||||||||||||||||||||||||||||||||||||||||||||||||||||||||||
| Other | 290 | |||||||||||||||||||||||||||||||||||||||||||||||||||||||||||||||||||||||||||||||||||||||||||||||||||||||||||||
2002 - 2018 National Fire Incident Reporting System (NFIRS) incidents
- Incident types reported to NFIRS in Glenwood, MN
- 49850.5%Fire
- 19519.8%Hazardous Condition
- 11111.2%Rescue & EMS
- 717.2%False Alarm
- 525.3%Good Intent Call
- 353.5%Severe Weather
- 202.0%Service Call
- 40.4%Overpressure Rupture
- 10.1%Special Incident
- Fire incident types reported to NFIRS in Glenwood, MN
- 20040.2%Outside Fires
- 17635.3%Structure Fires
- 6713.5%Mobile Property/Vehicle Fires
- 5511.0%Other
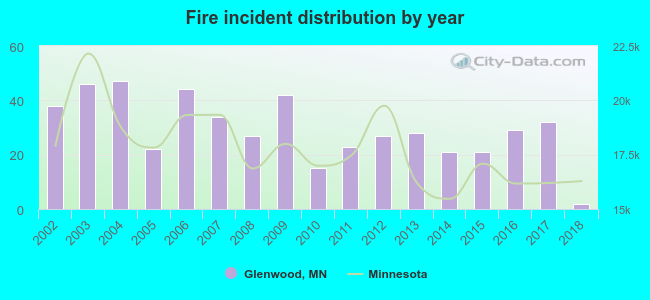 Based on the data from the years 2002 - 2018 the average number of fires per year is 29. The highest number of reported fires - 47 took place in 2004, and the least - 2 in 2018. The data has a declining trend.
 29.9% incidents where reported in the morning and 70.1% in the evening. The most fires (16.5%) took place on Sunday, and the least (12.7%) on Tuesday.
 Based on the 498 fire incident reports from years 2002 - 2018 most fires (14.7%) took place during May, and the least (4.2%) in December.
 Out of all 987 cases reported during the years 2002 - 2018, the most belonged to the categories: Fire (50.5%), Hazardous Condition (19.8%), and Rescue & EMS (11.2%).
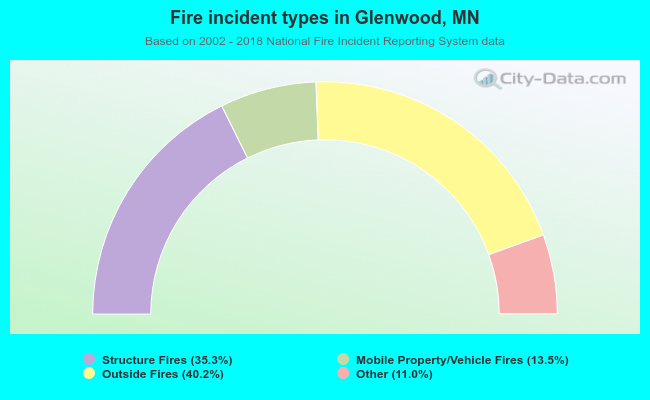 When looking into fire subcategories, the most reports belonged to: Outside Fires (40.2%), and Structure Fires (35.3%).