Glendale: Fire Incidents, Ohio (OH)
Where are fire incidents reported in Glendale, OH
Something went wrong! Please refresh the page.
|
| |||||||||||||||||||||||||||||||||||||||||||||||||||||||||||||||||||||||||||||||||||||||||||||||||||||||||||||
2002 - 2018 National Fire Incident Reporting System (NFIRS) incidents
- Incident types reported to NFIRS in Glendale, OH
- 61529.1%Rescue & EMS
- 41219.5%Hazardous Condition
- 30314.3%Fire
- 29614.0%Service Call
- 26012.3%False Alarm
- 1999.4%Good Intent Call
- 190.9%Severe Weather
- 50.2%Overpressure Rupture
- 40.2%Special Incident
- Fire incident types reported to NFIRS in Glendale, OH
- 21270.0%Structure Fires
- 6019.8%Outside Fires
- 299.6%Mobile Property/Vehicle Fires
- 20.7%Other
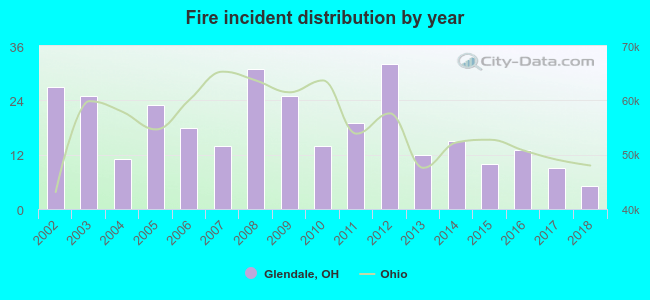 Based on the data from the years 2002 - 2018 the average number of fires per year is 18. The highest number of fires - 32 took place in 2012, and the least - 5 in 2018. The data has a declining trend.
 33.0% incidents where reported in the morning and 67.0% in the evening. The most fires (21.8%) took place on Saturday, and the least (11.6%) on Monday.
 According to the 303 fire incident reports from years 2002 - 2018 most fires (18.8%) took place during January, and the least (4.3%) in August.
 Out of all 2,113 cases reported during the years 2002 - 2018, the most belonged to the categories: Rescue & EMS (29.1%), Hazardous Condition (19.5%), and Fire (14.3%).
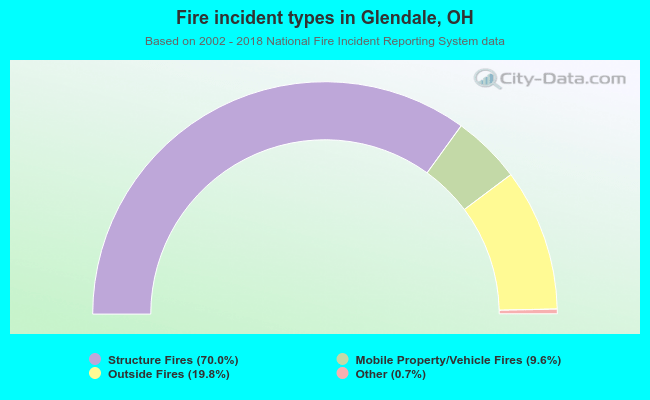 When looking into fire subcategories, the most reports belonged to: Structure Fires (70.0%), and Outside Fires (19.8%).