| Fire incidents reported |
|---|
| Sreet name | Count |
|---|
| MONONGAHELA AVE | 78 | | OHIO AVE | 52 | | PATTERSON PROPERTY | 46 | | INDIANA AVE | 30 | | ERIE AVE | 22 | | MARIE ST | 22 | | VERMONT AVE | 18 | | ALLEGHENY AVE | 16 | | DELAWARE AVE | 14 | | MARYLAND AVE | 14 | | CYPRESS WAY | 12 | | OAK ALY | 12 | | HEMLOCK ALY | 10 | | MONONGAHELA AVE | 10 | | 9TH ST | 8 | | PATTERSON PROPERTY FLDS | 8 | | 6 & OHIO AVE | 6 | | FAIRVIEW AVE | 6 | | MICHIGAN AVE | 6 | | NAOMI AVE | 6 | | PEACH ALY | 6 | | WASHINGTON BLVD | 6 | | 3 & MONONGAHELA AVE | 4 | | 525 ALLEGHENY AVE | 4 | | 7 & OHIO AVE | 4 |
| | | Fire incidents reported |
|---|
| Sreet name | Count |
|---|
| 7TH OHIO AVE | 4 | | ALLEGHENY AVE | 4 | | ALLEGHENY SQ | 4 | | DETROIT HOLW | 4 | | ELM STS | 4 | | EUCLID AVE | 4 | | GLASSPORT DUMP | 4 | | HARRISON ST | 4 | | HARRISON STS | 4 | | MARYLAND | 4 | | MONOGEHELA AVE | 4 | | MONONGAHELA | 4 | | WADDELL AVE | 4 | | WASHINGTON BLVD BLVD | 4 | | WEST ALY | 4 | | 1 & MONONGAHELA AVE | 2 | | 3RD STS | 2 | | 5 & OHIO AVE | 2 | | 508 8TH STREET | 2 | | 5TH MONONGAHELA AVE | 2 | | 5TH STS | 2 | | 638 OHIO AVE | 2 | | 641 MONONGAHELA REAR AVE ALY | 2 | | 6TH & OHIO AVE | 2 | | |
|
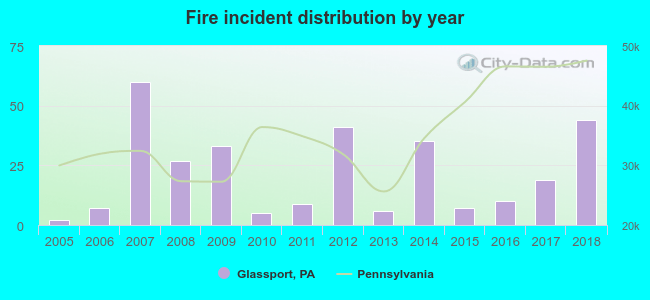 According to the data from the years 2005 - 2018 the average number of fire incidents per year is 22. The highest number of reported fires - 60 took place in 2007, and the least - 2 in 2005. The data has a rising trend.
 23.9% incidents where reported in the morning and 76.1% in the evening. The most fires (18.4%) took place on Friday, and the least (9.5%) on Wednesday.
 Based on the 305 incident reports from years 2005 - 2018 most fires (10.8%) took place during June, and the least (5.2%) in February.
 Out of all 987 cases reported during the years 2005 - 2018, the most belonged to the categories: Rescue & EMS (37.8%), Fire (30.9%), and Overpressure Rupture (10.6%).
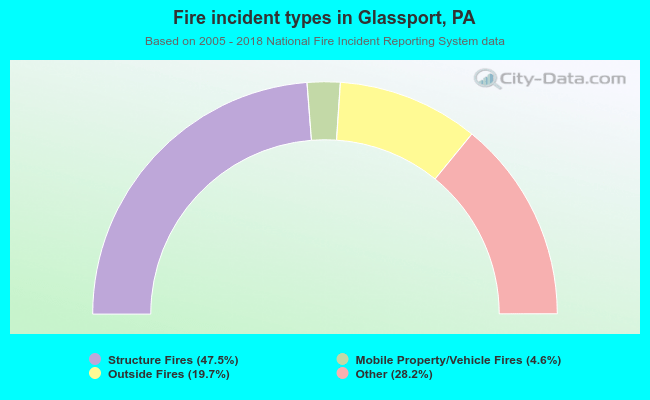 When looking into fire subcategories, the most incidents belonged to: Structure Fires (47.5%), and Other (28.2%).