Gladstone: Fire Incidents, Michigan (MI)
Where are fire incidents reported in Gladstone, MI
Something went wrong! Please refresh the page.
|
| |||||||||||||||||||||||||||||||||||||||||||||||||||||||||||||||||||||||||||||||||||||||||||||||||||||||||||||
| Other | 41 | |||||||||||||||||||||||||||||||||||||||||||||||||||||||||||||||||||||||||||||||||||||||||||||||||||||||||||||
2002 - 2018 National Fire Incident Reporting System (NFIRS) incidents
- Incident types reported to NFIRS in Gladstone, MI
- 43962.6%Fire
- 13619.4%Hazardous Condition
- 426.0%False Alarm
- 284.0%Rescue & EMS
- 284.0%Good Intent Call
- 213.0%Service Call
- 30.4%Overpressure Rupture
- 30.4%Severe Weather
- 10.1%Special Incident
- Fire incident types reported to NFIRS in Gladstone, MI
- 18642.4%Structure Fires
- 14432.8%Outside Fires
- 7517.1%Mobile Property/Vehicle Fires
- 347.7%Other
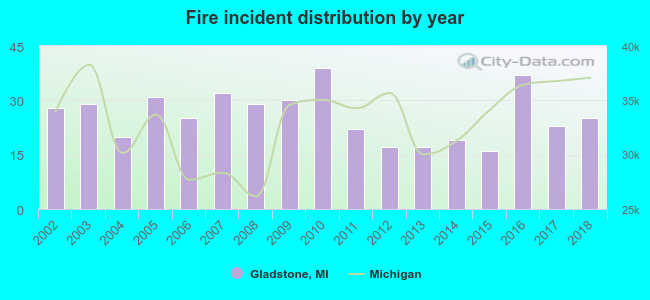 Based on the data from the years 2002 - 2018 the average number of fire incidents per year is 26. The highest number of fire incidents - 39 took place in 2010, and the least - 16 in 2015. The data has a dropping trend.
 Based on the reports from the years 2002 - 2018 the average number of fire-related yearly casualties is 0. The highest number of casualties - 2 took place in 2005, and the lowest - 0 in 2003. The data has a dropping trend.
 25.7% incidents where reported in the morning and 74.3% in the evening. The most fires (18.0%) took place on Sunday, and the least (10.5%) on Thursday.
 Based on the 439 fire incident reports from years 2002 - 2018 most fires (16.2%) took place during April, and the least (4.1%) in February.
 Out of all 701 cases reported during the years 2002 - 2018, the most belonged to the categories: Fire (62.6%), Hazardous Condition (19.4%), and False Alarm (6.0%).
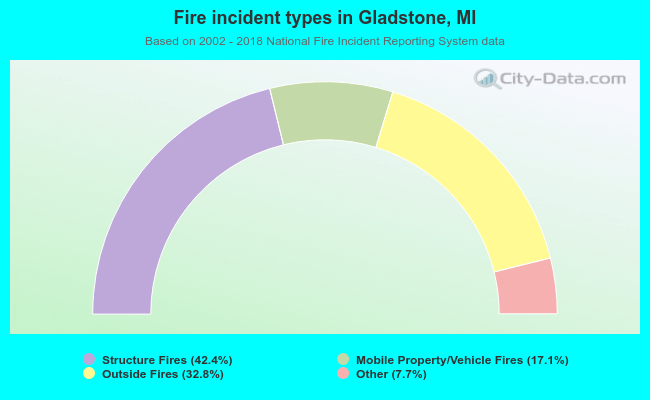 When looking into fire subcategories, the most incidents belonged to: Structure Fires (42.4%), and Outside Fires (32.8%).