Girard: Fire Incidents, Illinois (IL)
Where are fire incidents reported in Girard, IL
Something went wrong! Please refresh the page.
|
| |||||||||||||||||||||||||||||||||||||||||||||||||||||||||||||||||||||||||||||||||||||||||||||||||||||||||||||
| Other | 19 | |||||||||||||||||||||||||||||||||||||||||||||||||||||||||||||||||||||||||||||||||||||||||||||||||||||||||||||
2002 - 2018 National Fire Incident Reporting System (NFIRS) incidents
- Incident types reported to NFIRS in Girard, IL
- 31373.1%Fire
- 358.2%Service Call
- 276.3%Good Intent Call
- 266.1%Hazardous Condition
- 235.4%False Alarm
- 20.5%Rescue & EMS
- 10.2%Overpressure Rupture
- 10.2%Special Incident
- Fire incident types reported to NFIRS in Girard, IL
- 12339.3%Outside Fires
- 9028.8%Structure Fires
- 7423.6%Other
- 268.3%Mobile Property/Vehicle Fires
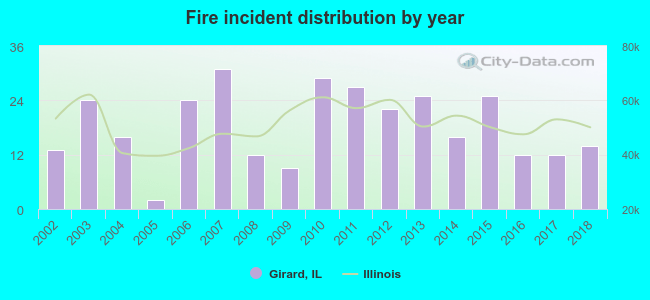 According to the data from the years 2002 - 2018 the average number of fires per year is 18. The highest number of fire incidents - 31 took place in 2007, and the least - 2 in 2005. The data has an increasing trend.
 27.8% incidents where reported in the morning and 72.2% in the evening. The most fires (17.6%) took place on Friday, and the least (12.8%) on Monday.
 According to the 313 reports from years 2002 - 2018 most fires (15.3%) took place during March, and the least (4.5%) in December.
 Out of all 428 cases reported during the years 2002 - 2018, the most belonged to the categories: Fire (73.1%), Service Call (8.2%), and Good Intent Call (6.3%).
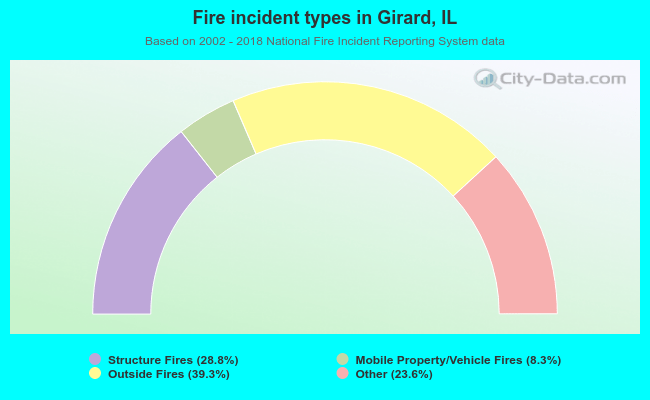 When looking into fire subcategories, the most reports belonged to: Outside Fires (39.3%), and Structure Fires (28.8%).