Gillette: Fire Incidents, Wyoming (WY)
Where are fire incidents reported in Gillette, WY
Something went wrong! Please refresh the page.
| Fire incidents reported | |
|---|---|
| Sreet name | Count |
| GARNER LAKE RD | 114 |
| DOUGLAS HWY | 106 |
| HWY 59 | 92 |
| HIGHWAY 14-16 | 72 |
| HIGHWAY 59 | 62 |
| ECHETA RD | 60 |
| BOXELDER RD | 56 |
| HWY 1416 | 48 |
| I90 | 46 |
| SECOND ST | 44 |
| FOUR J RD | 42 |
| GILLETTE AVE | 42 |
| GURLEY AVE | 40 |
| EIGHTH ST | 38 |
| WARLOW DR | 38 |
| INTERSTATE 90 | 34 |
| BISHOP RD | 32 |
| CHURCH ST | 32 |
| ADON RD | 30 |
| HANNUM RD | 30 |
| LARAMIE ST | 30 |
| HIGHWAY 51 HWY | 28 |
| HWY 50 | 28 |
| LINCOLN ST | 26 |
| COUNTRY CLUB RD | 24 |
| EXPRESS DR | 24 |
| BUTLER SPAETH RD | 22 |
| HWY 51 | 22 |
| STANLEY AVE | 22 |
| CAMEL DR | 20 |
| Other | 1,585 |
2002 - 2018 National Fire Incident Reporting System (NFIRS) incidents
- Incident types reported to NFIRS in Gillette, WY
- 3,83833.6%Rescue & EMS
- 2,88925.3%Fire
- 1,88916.6%Hazardous Condition
- 1,44612.7%Good Intent Call
- 7987.0%False Alarm
- 4614.0%Service Call
- 520.5%Severe Weather
- 270.2%Overpressure Rupture
- 130.1%Special Incident
- Fire incident types reported to NFIRS in Gillette, WY
- 1,73059.9%Outside Fires
- 70424.4%Structure Fires
- 41814.5%Mobile Property/Vehicle Fires
- 371.3%Other
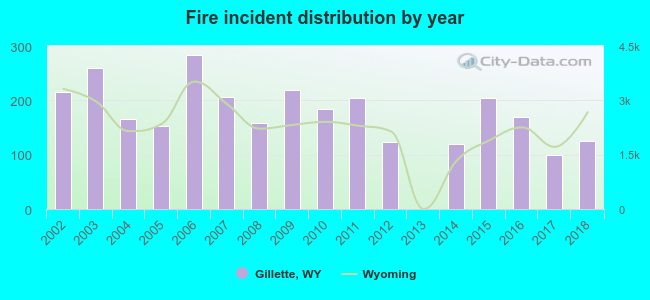 Based on the data from the years 2002 - 2018 the average number of fires per year is 170. The highest number of fire incidents - 283 took place in 2006, and the least - 0 in 2013. The data has a decreasing trend.
The average number of yearly fire incidents per 10k residents in Gillette, WY compared to nearest cities:
(Note: Based on data for the last 3 years, including only cities with population 5,000 and above)
| Gillette: | 41.1 |
| Sheridan: | 15.8 |
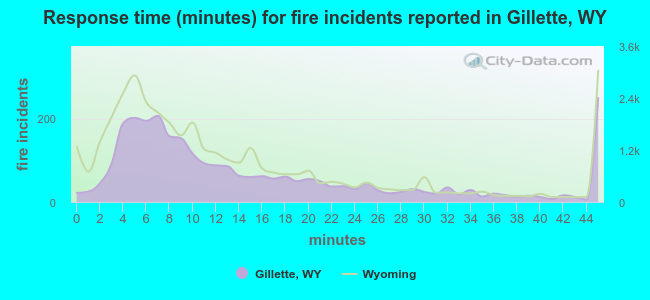 The median response time based on all reported fire incidents is 11 minutes. This is comparable to the state median value.
The median response time in Gillette, WY compared to nearest cities:
(Note: Based on data for all years, including only cities with at least 500 fire incidents)
| Gillette: | 11 minutes |
| Wright: | 23 minutes |
| Newcastle: | 20 minutes |
| Sheridan: | 6 minutes |
| Sturgis: | 11 minutes |
| Rapid City: | 7 minutes |
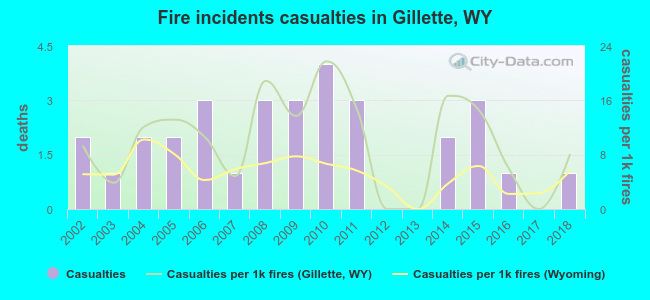 Based on the reports from the years 2002 - 2018 the average number of fire-related yearly casualties is 2. The highest number of reported casualties - 4 took place in 2010, and the lowest - 0 in 2012. The data has a dropping trend.
The average number of casualties per 1,000 fire incidents is 10. This indicator was the highest - 22 in 2010, and the lowest 0 in 2012. The trend for injuries per 1,000 incidents is decreasing. Compared to the state value the number of injuries per 1,000 fires is higher.
Based on the reports from the years 2002 - 2018 the average number of fire-related yearly casualties is 2. The highest number of reported casualties - 4 took place in 2010, and the lowest - 0 in 2012. The data has a dropping trend.
The average number of casualties per 1,000 fire incidents is 10. This indicator was the highest - 22 in 2010, and the lowest 0 in 2012. The trend for injuries per 1,000 incidents is decreasing. Compared to the state value the number of injuries per 1,000 fires is higher.Casualties per 1,000 incidents in Gillette, WY compared to nearest cities:
(Note: Based on data for all years, including only cities with at least 500 fire incidents)
| Gillette: | 10.7 |
| Wright: | 0.0 |
| Newcastle: | 0.0 |
| Sheridan: | 6.3 |
| Sturgis: | 3.2 |
| Rapid City: | 9.7 |
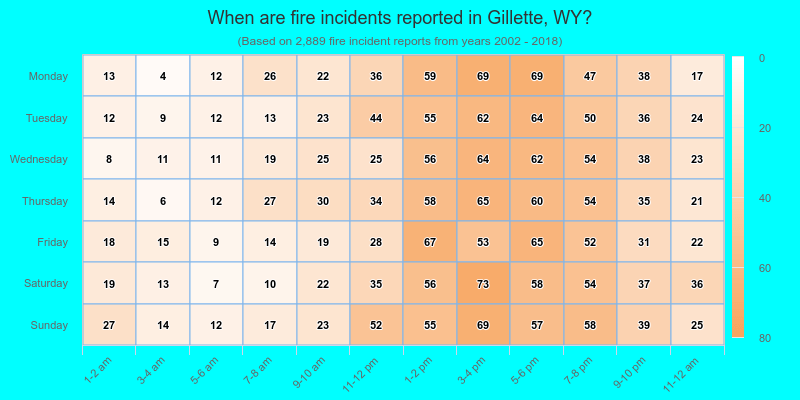
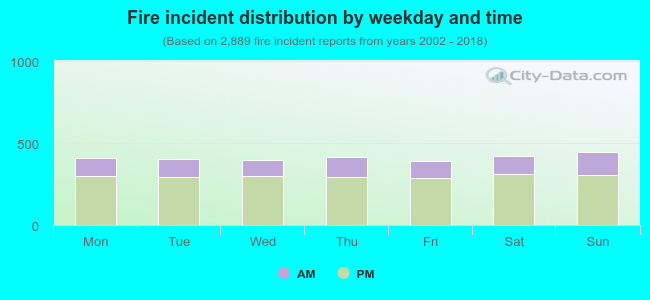 27.8% incidents where reported in the morning and 72.2% in the evening. The most fires (15.5%) took place on Sunday, and the least (13.6%) on Friday.
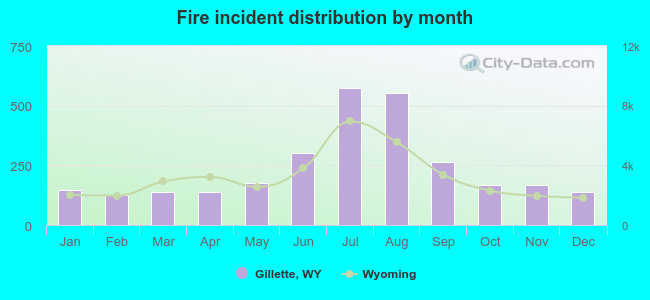 Based on the 2,889 fire incidents from years 2002 - 2018 most fires (19.8%) took place during July, and the least (4.3%) in February.
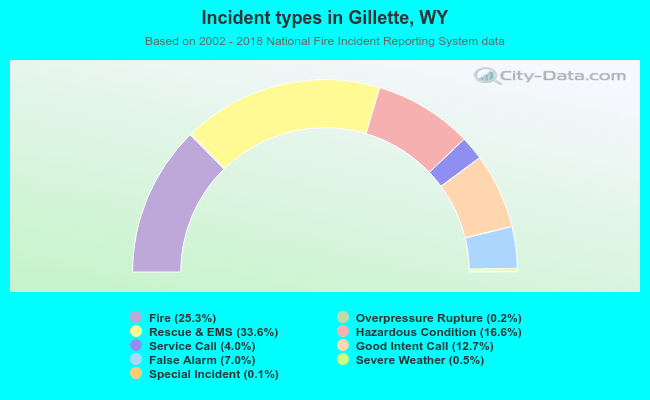 Out of all 11,413 cases reported during the years 2002 - 2018, the most belonged to the categories: Rescue & EMS (33.6%), Fire (25.3%), and Hazardous Condition (16.6%).
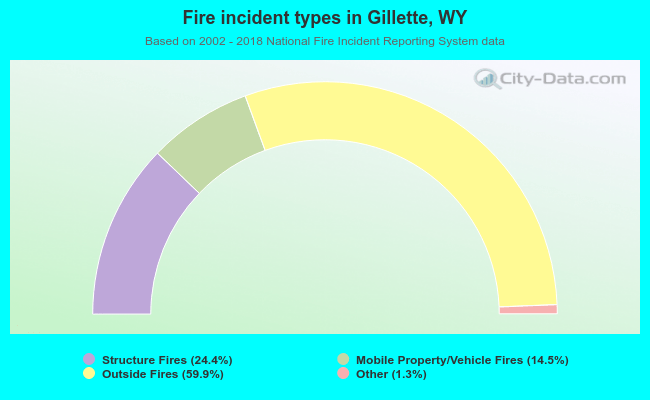 When looking into fire subcategories, the most incidents belonged to: Outside Fires (59.9%), and Structure Fires (24.4%).