Gillett: Fire Incidents, Wisconsin (WI)
Where are fire incidents reported in Gillett, WI
Something went wrong! Please refresh the page.
|
| |||||||||||||||||||||||||||||||||||||||||||||||||||||||||||||||||||||||||||||||||||||||||||||||||||||||||||||
| Other | 4 | |||||||||||||||||||||||||||||||||||||||||||||||||||||||||||||||||||||||||||||||||||||||||||||||||||||||||||||
2003 - 2018 National Fire Incident Reporting System (NFIRS) incidents
- Incident types reported to NFIRS in Gillett, WI
- 22254.7%Fire
- 6415.8%Rescue & EMS
- 6315.5%Hazardous Condition
- 235.7%False Alarm
- 225.4%Good Intent Call
- 71.7%Service Call
- 30.7%Severe Weather
- 20.5%Special Incident
- Fire incident types reported to NFIRS in Gillett, WI
- 13862.2%Structure Fires
- 5223.4%Outside Fires
- 229.9%Mobile Property/Vehicle Fires
- 104.5%Other
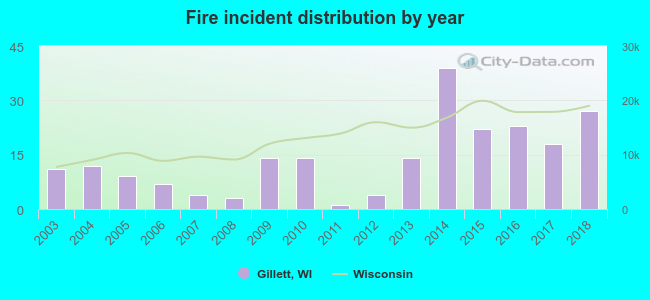 According to the data from the years 2003 - 2018 the average number of fire incidents per year is 14. The highest number of reported fires - 39 took place in 2014, and the least - 1 in 2011. The data has an increasing trend.
 26.6% incidents where reported in the morning and 73.4% in the evening. The most fires (18.5%) took place on Wednesday, and the least (10.4%) on Sunday.
 Based on the 222 fires from years 2003 - 2018 most fires (14.4%) took place during April, and the least (4.1%) in August.
 Out of all 406 cases reported during the years 2003 - 2018, the most belonged to the categories: Fire (54.7%), Overpressure Rupture (15.8%), and Rescue & EMS (15.5%).
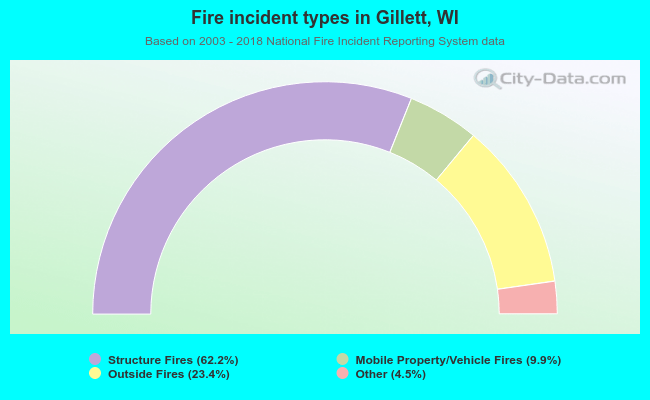 When looking into fire subcategories, the most reports belonged to: Structure Fires (62.2%), and Outside Fires (23.4%).