Gilbertsville: Fire Incidents, Pennsylvania (PA)
Where are fire incidents reported in Gilbertsville, PA
Something went wrong! Please refresh the page.
|
| |||||||||||||||||||||||||||||||||||||||||||||||||||||||||||||||||||||||||||||||||||||||||||||||||||||||||||||
2003 - 2018 National Fire Incident Reporting System (NFIRS) incidents
- Incident types reported to NFIRS in Gilbertsville, PA
- 29343.8%Fire
- 18327.4%Hazardous Condition
- 639.4%Rescue & EMS
- 507.5%Service Call
- 416.1%False Alarm
- 334.9%Good Intent Call
- 30.4%Special Incident
- 20.3%Severe Weather
- 10.1%Overpressure Rupture
- Fire incident types reported to NFIRS in Gilbertsville, PA
- 17058.0%Structure Fires
- 7927.0%Outside Fires
- 3712.6%Mobile Property/Vehicle Fires
- 72.4%Other
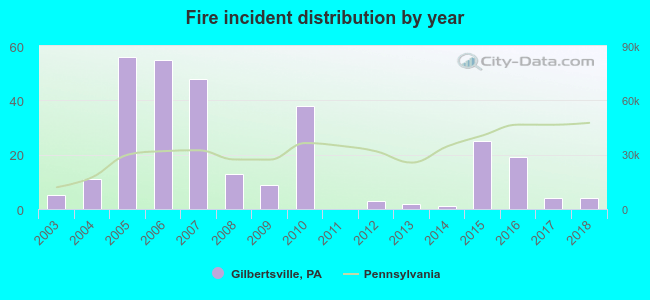 According to the data from the years 2003 - 2018 the average number of fire incidents per year is 18. The highest number of reported fires - 56 took place in 2005, and the least - 0 in 2011. The data has a declining trend.
 Based on the reports from the years 2003 - 2018 the average number of fire-related casualties per year is 0. The highest number of casualties - 2 took place in 2004, and the lowest - 0 in 2003. The data has a constant trend.
 28.7% incidents where reported in the morning and 71.3% in the evening. The most fires (18.1%) took place on Tuesday, and the least (11.3%) on Monday.
 Based on the 293 fires from years 2003 - 2018 most fires (12.3%) took place during March, and the least (3.8%) in October.
 Out of all 669 cases reported during the years 2003 - 2018, the most belonged to the categories: Fire (43.8%), Hazardous Condition (27.4%), and Rescue & EMS (9.4%).
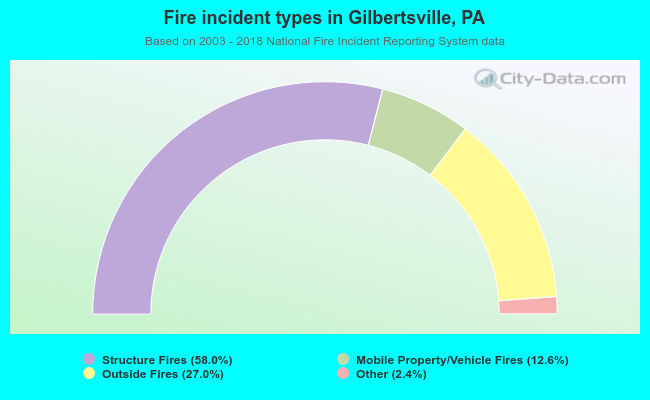 When looking into fire subcategories, the most incidents belonged to: Structure Fires (58.0%), and Outside Fires (27.0%).