Gibson City: Fire Incidents, Illinois (IL)
Where are fire incidents reported in Gibson City, IL
Something went wrong! Please refresh the page.
|
| |||||||||||||||||||||||||||||||||||||||||||||||||||||||||||||||||||||||||||||||||||||||||||||||||||||||||||||
2007 - 2018 National Fire Incident Reporting System (NFIRS) incidents
- Incident types reported to NFIRS in Gibson City, IL
- 20444.4%Fire
- 11024.0%Hazardous Condition
- 8618.7%Rescue & EMS
- 327.0%False Alarm
- 163.5%Good Intent Call
- 92.0%Service Call
- 10.2%Overpressure Rupture
- 10.2%Severe Weather
- Fire incident types reported to NFIRS in Gibson City, IL
- 8340.7%Outside Fires
- 7335.8%Structure Fires
- 3919.1%Mobile Property/Vehicle Fires
- 94.4%Other
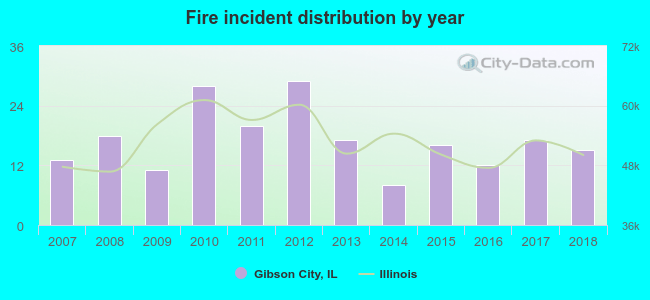 According to the data from the years 2007 - 2018 the average number of fire incidents per year is 17. The highest number of reported fire incidents - 29 took place in 2012, and the least - 8 in 2014. The data has an increasing trend.
 26.0% incidents where reported in the morning and 74.0% in the evening. The most fires (17.2%) took place on Wednesday, and the least (11.3%) on Monday.
 Based on the 204 fires from years 2007 - 2018 most fires (15.2%) took place during October, and the least (3.4%) in February.
 Out of all 459 cases reported during the years 2007 - 2018, the most belonged to the categories: Fire (44.4%), Hazardous Condition (24.0%), and Rescue & EMS (18.7%).
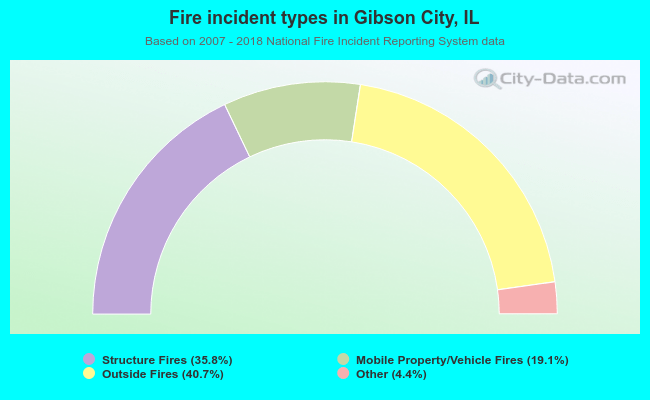 When looking into fire subcategories, the most incidents belonged to: Outside Fires (40.7%), and Structure Fires (35.8%).