Gaston: Fire Incidents, North Carolina (NC)
Where are fire incidents reported in Gaston, NC
Something went wrong! Please refresh the page.
|
| |||||||||||||||||||||||||||||||||||||||||||||||||||||||||||||||||||||||||||||||||||||||||||||||||||||||||||||
| Other | 95 | |||||||||||||||||||||||||||||||||||||||||||||||||||||||||||||||||||||||||||||||||||||||||||||||||||||||||||||
2003 - 2018 National Fire Incident Reporting System (NFIRS) incidents
- Incident types reported to NFIRS in Gaston, NC
- 42533.9%Fire
- 35528.3%Hazardous Condition
- 21417.1%Rescue & EMS
- 19315.4%Good Intent Call
- 453.6%False Alarm
- 191.5%Service Call
- 20.2%Special Incident
- Fire incident types reported to NFIRS in Gaston, NC
- 16338.4%Outside Fires
- 13632.0%Structure Fires
- 11126.1%Mobile Property/Vehicle Fires
- 153.5%Other
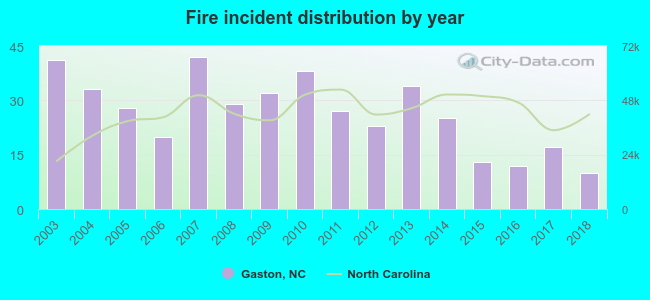 Based on the data from the years 2003 - 2018 the average number of fires per year is 27. The highest number of reported fire incidents - 42 took place in 2007, and the least - 10 in 2018. The data has a declining trend.
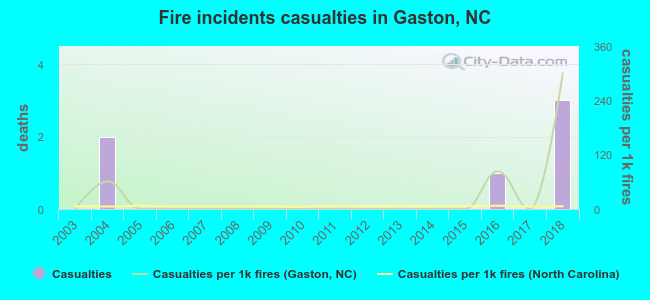 Based on the reports from the years 2003 - 2018 the average number of fire-related yearly casualties is 0. The highest number of casualties - 3 took place in 2018, and the lowest - 0 in 2003. The data has a rising trend.
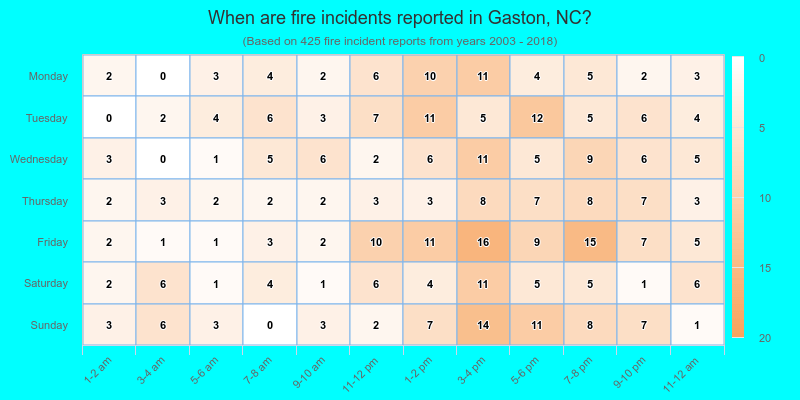
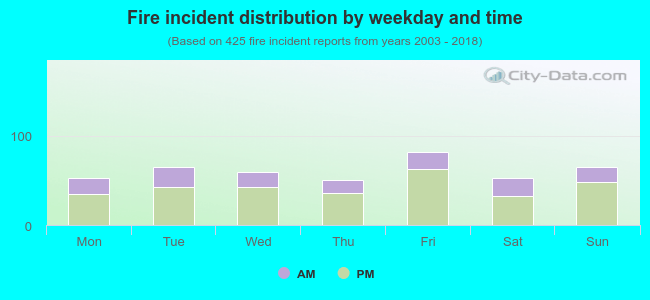 29.6% incidents where reported in the morning and 70.4% in the evening. The most fires (19.3%) took place on Friday, and the least (11.8%) on Thursday.
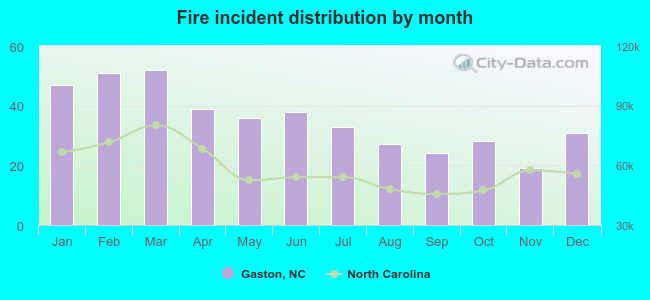 Based on the 425 incident reports from years 2003 - 2018 most fires (12.2%) took place during March, and the least (4.5%) in November.
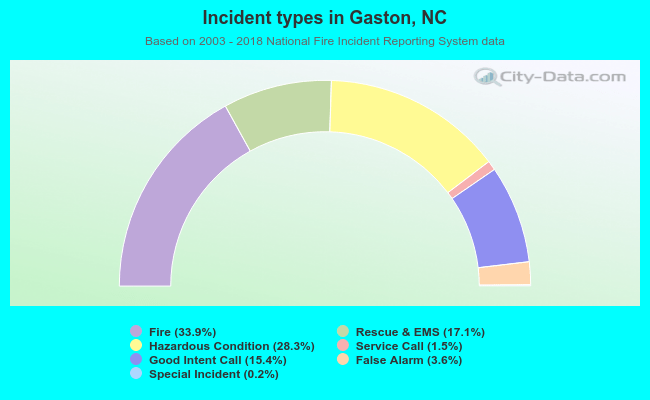 Out of all 1,253 cases reported during the years 2003 - 2018, the most belonged to the categories: Fire (33.9%), Rescue & EMS (28.3%), and Overpressure Rupture (17.1%).
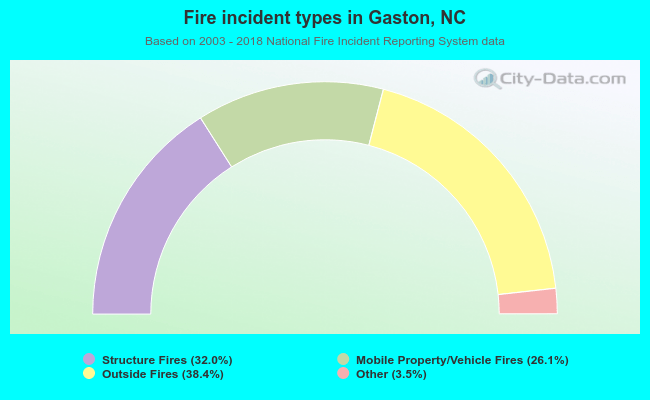 When looking into fire subcategories, the most incidents belonged to: Outside Fires (38.4%), and Structure Fires (32.0%).