| Fire incidents reported |
|---|
| Sreet name | Count |
|---|
| I95 | 18 | | LEBANON CHURCH RD | 18 | | NC 46 HWY | 14 | | HIGHWAY 301 | 12 | | HWY 301 | 12 | | I95 HWY | 8 | | 185 WARNER BRIDGE RD. | 6 | | 620 LOWES BLVD | 6 | | BERRY SCOTT TRL | 6 | | CAL FLOYD RD | 6 | | HIGHWAY 186 | 6 | | HIGHWAY 301 NORTH | 6 | | HIGHWAY 46 HWY | 6 | | HWY 301 NORTH | 6 | | IVEY ST | 6 | | MACON PRICE RD | 6 | | NC 46 HIGHWAY | 6 | | SANDY LN | 6 | | 1022 ELAM CHURCH RD | 4 | | 163 CLEMENTS TRAILOR PARK | 4 | | 32 IVEY STREET | 4 | | 830 LEBANON CHURCH RD | 4 | | CORNWALLIS RD | 4 | | GARNER RD | 4 | | GEORGE LN | 4 |
| | | Fire incidents reported |
|---|
| Sreet name | Count |
|---|
| GILT LANE | 4 | | HIGHWAY 301 SOUTH | 4 | | HIGHWAY 46 | 4 | | HILLTOP DRIVE | 4 | | HWY 46 | 4 | | LEBANON CHURCH ROAD | 4 | | LOWES BOULEVARD | 4 | | MAPLE & APPLE STREET | 4 | | OLD HIGHWAY | 4 | | OLD HIGHWAY RD | 4 | | THACKER LN | 4 | | WARNER BRIDGE RD | 4 | | 100 BUFFALOE STREET | 2 | | 100 E RAILROAD STREET | 2 | | 100 GRANT ST | 2 | | 100 GREGORY ST | 2 | | 100 MONROE STREET | 2 | | 1009 HIGHWAY 186 | 2 | | 1009 NC HWY 186 | 2 | | 101 MAPLE ST. | 2 | | 102 COLLIER STREET | 2 | | 103 ROSE STREET | 2 | | 104 PERRY ST. | 2 | | 104 PERRY STREET | 2 | | 105 WASHINGTON STREET | 2 |
|
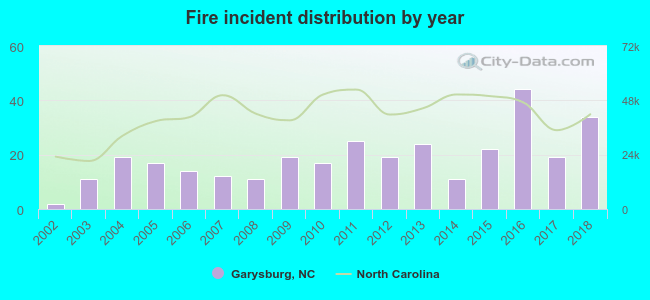 Based on the data from the years 2002 - 2018 the average number of fires per year is 19. The highest number of reported fire incidents - 44 took place in 2016, and the least - 2 in 2002. The data has a rising trend.
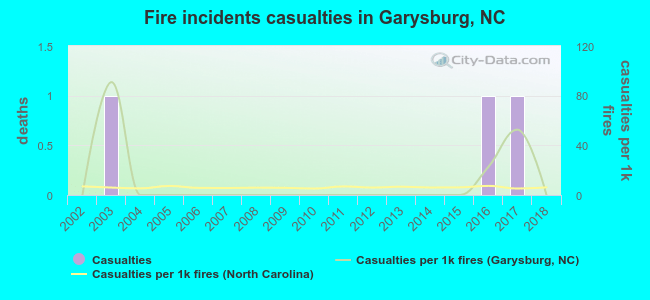 Based on the reports from the years 2002 - 2018 the average number of fire-related yearly casualties is 0. The highest number of casualties - 1 took place in 2003, and the lowest - 0 in 2002. The data has a constant trend.
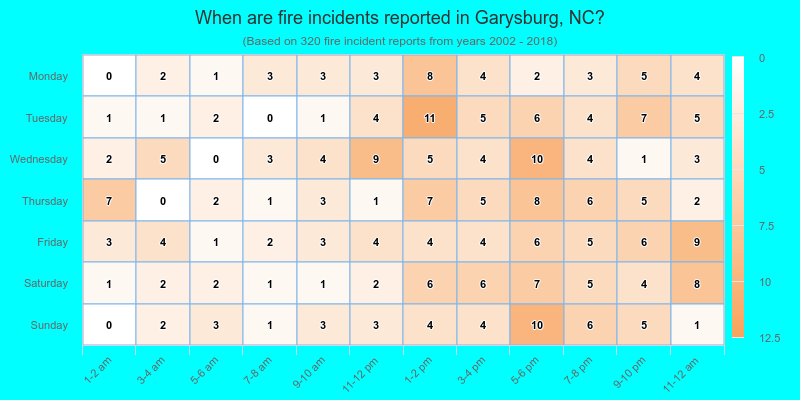
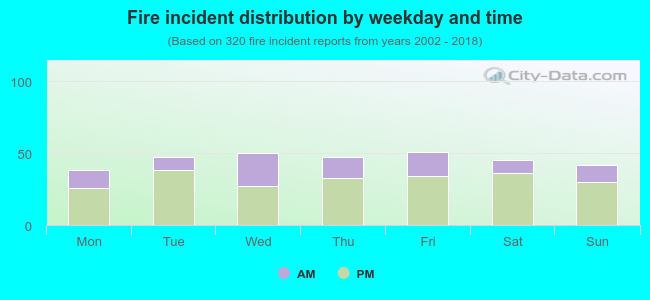 30.0% incidents where reported in the morning and 70.0% in the evening. The most fires (15.9%) took place on Friday, and the least (11.9%) on Monday.
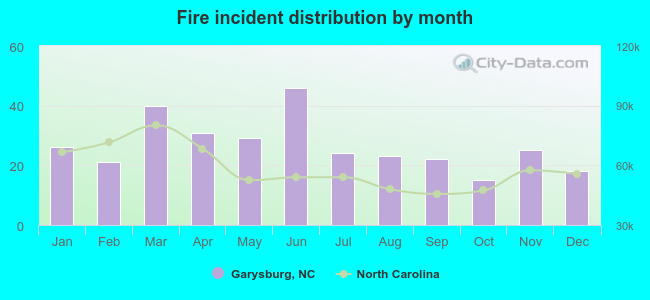 Based on the 320 fire incident reports from years 2002 - 2018 most fires (14.4%) took place during June, and the least (4.7%) in October.
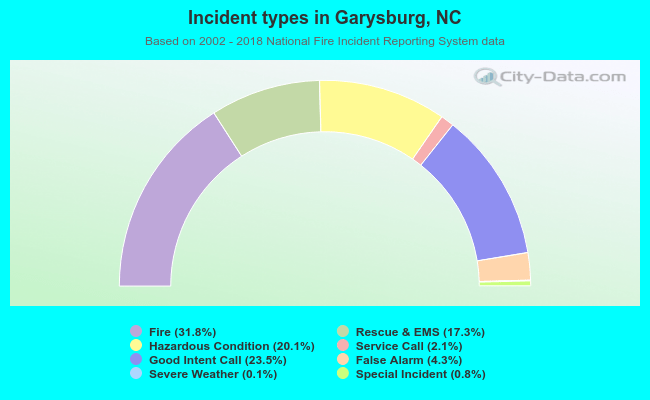 Out of all 1,005 cases reported during the years 2002 - 2018, the most belonged to the categories: Fire (31.8%), Service Call (23.5%), and Rescue & EMS (20.1%).
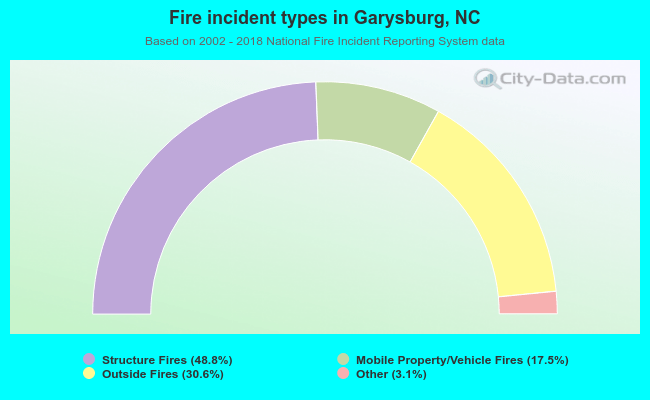 When looking into fire subcategories, the most reports belonged to: Structure Fires (48.8%), and Outside Fires (30.6%).