| Fire incidents reported |
|---|
| Sreet name | Count |
|---|
| BRANDERMILL BLVD | 18 | | WAUGH CHAPEL RD | 16 | | CHAPEL LAKE DR | 12 | | DICUS MILL RD | 12 | | RT3 | 12 | | DAVIDSONVILLE RD | 10 | | MAIN CHAPEL WAY | 10 | | ANNAPOLIS RD | 8 | | RT 3 | 8 | | BELL BRANCH RD | 6 | | BURNS CROSSING RD | 6 | | CAROL AVE | 6 | | GAMBRILLS RD | 6 | | MT TABOR RD | 6 | | PREAKNESS DR | 6 | | ST STEPHENS CHURCH RD | 6 | | 2054 HUNTWOOD DR | 4 | | 677 MCKNEW RD | 4 | | CALIFORNIA TER | 4 | | CHEYENNE DR | 4 | | DAVIDSONVILLE RD | 4 | | DEFENSE HWY | 4 | | HAVERFORD CIR | 4 | | MISTHAVEN LANE | 4 | | POLLY PL | 4 |
| | | Fire incidents reported |
|---|
| Sreet name | Count |
|---|
| RT 3 S | 4 | | RT3 S | 4 | | RT3 SOUTH | 4 | | SADDLE DR | 4 | | SYMPHONY LN | 4 | | 100 DAIRY LN | 2 | | 1002 ICE CASTLE CT | 2 | | 1088 CRAIN HWY S | 2 | | 1110 SAINT STEPHENS CHURCH RD | 2 | | 1221 WAUGH CHAPEL RD | 2 | | 1230 WAUGH CHAPEL RD | 2 | | 1260 DEFENSE HWY | 2 | | 1412 S MAIN CHAPEL WAY | 2 | | 1413 S MAIN CHAPEL WAY | 2 | | 1419 S MAIN CHAPEL WAY | 2 | | 1448 DEFENSE HWY | 2 | | 1547 UNDERWOOD RD | 2 | | 1581 DEFENSE HWY | 2 | | 1668 PREAKNESS DR | 2 | | 1753 ARROWOOD DR | 2 | | 1770 BALDWIN DR | 2 | | 2190 HALLMARK CT | 2 | | 2198 DAIRY FARM RD | 2 | | 2281 SNOWFALL CT | 2 | | |
|
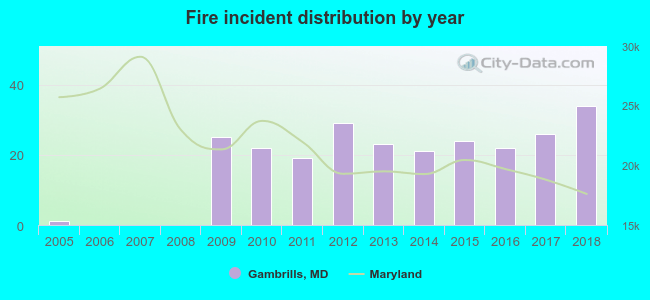 Based on the data from the years 2005 - 2018 the average number of fire incidents per year is 18. The highest number of fire incidents - 34 took place in 2018, and the least - 0 in 2006. The data has an increasing trend.
 30.9% incidents where reported in the morning and 69.1% in the evening. The most fires (16.3%) took place on Monday, and the least (10.2%) on Tuesday.
 Based on the 246 reports from years 2005 - 2018 most fires (14.6%) took place during April, and the least (5.3%) in June.
 Out of all 5,790 cases reported during the years 2005 - 2018, the most belonged to the categories: Rescue & EMS (67.0%), Good Intent Call (10.3%), and False Alarm (6.5%).
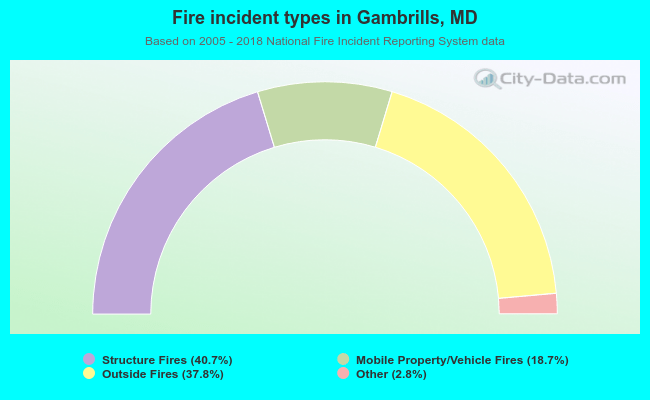 When looking into fire subcategories, the most incidents belonged to: Structure Fires (40.7%), and Outside Fires (37.8%).