| Fire incidents reported |
|---|
| Sreet name | Count |
|---|
| HWY 53 | 6 | | SAHLSTROM LN | 6 | | 16210 RIDGEVIEW DRIVE | 4 | | CRYSTAL VALLEY RD | 4 | | DICK LN | 4 | | GALE AVE | 4 | | HESS RD | 4 | | HOLCOMB COULEE RD | 4 | | MAIN | 4 | | MCGILVARY RD | 4 | | N17432 N 4TH ST | 4 | | OAK RIDGE DR | 4 | | OAK RIDGE ROAD LGTS | 4 | | ST HWY 5493 | 4 | | TRIM RD | 4 | | 15TH STREET | 2 | | 16610 MAIN STREET | 2 | | 16726 S 12TH STREET | 2 | | 16758 SOUTH 12TH STREET | 2 | | 16854 S 9TH ST | 2 | | 16864 DAVIS STREET | 2 | | 17257 LAKE COURT | 2 | | 17494 HWY 53 | 2 | | 17511 NORTH MAIN STREET | 2 | | 20048 WEST MILL ROAD | 2 |
| | | Fire incidents reported |
|---|
| Sreet name | Count |
|---|
| 20053 GIBSON ST | 2 | | 20086 WEST RIDGE AVENUE | 2 | | 20133 W RIDGE AVE | 2 | | 20496 W CLARK AVE | 2 | | 20914 SACIA RD | 2 | | 21429 BROWNS ADDITION LN | 2 | | 22988 NICHOLS LN | 2 | | 3RD | 2 | | 5TH STREET | 2 | | ANDERSONS FEEDS | 2 | | BIBBY ST | 2 | | BRENEGAN LN | 2 | | COUNTY K | 2 | | COUNTY M | 2 | | COUNTY RD AA | 2 | | COUNTY RD T | 2 | | COUNTY ROAD K | 2 | | CRAFT BARN SILVER CREEK ROAD | 2 | | CRESTWOOD CT | 2 | | CRYSTAL VALLEY RD | 2 | | CRYSTAL VALLEY ROAD | 2 | | CTH K #AA15 | 2 | | CTY HWYT | 2 | | CTY RD M | 2 | | CTYK | 2 |
|
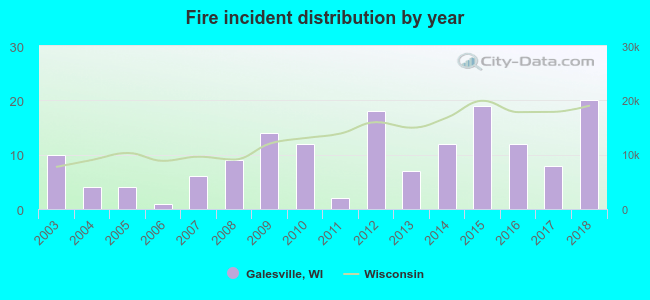 According to the data from the years 2003 - 2018 the average number of fire incidents per year is 10. The highest number of reported fires - 20 took place in 2018, and the least - 1 in 2006. The data has an increasing trend.
 29.1% incidents where reported in the morning and 70.9% in the evening. The most fires (18.4%) took place on Thursday, and the least (10.8%) on Sunday.
 Based on the 158 fires from years 2003 - 2018 most fires (21.5%) took place during April, and the least (3.8%) in October.
 Out of all 535 cases reported during the years 2003 - 2018, the most belonged to the categories: Rescue & EMS (30.5%), Fire (29.5%), and Hazardous Condition (20.2%).
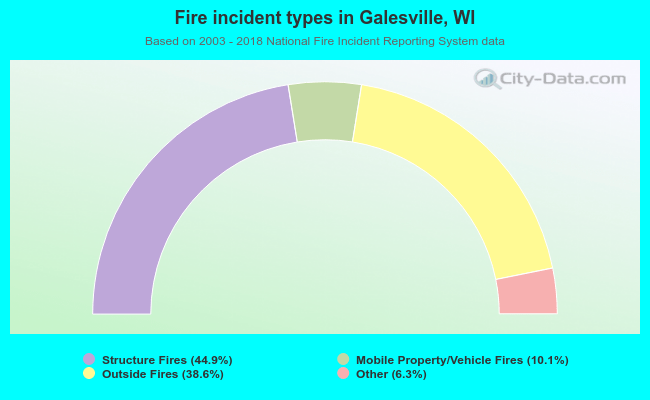 When looking into fire subcategories, the most reports belonged to: Structure Fires (44.9%), and Outside Fires (38.6%).