Galena: Fire Incidents, Illinois (IL)
Where are fire incidents reported in Galena, IL
Something went wrong! Please refresh the page.
|
| |||||||||||||||||||||||||||||||||||||||||||||||||||||||||||||||||||||||||||||||||||||||||||||||||||||||||||||
| Other | 80 | |||||||||||||||||||||||||||||||||||||||||||||||||||||||||||||||||||||||||||||||||||||||||||||||||||||||||||||
2005 - 2018 National Fire Incident Reporting System (NFIRS) incidents
- Incident types reported to NFIRS in Galena, IL
- 52032.4%Rescue & EMS
- 39624.7%Fire
- 29818.6%False Alarm
- 19111.9%Hazardous Condition
- 16310.1%Good Intent Call
- 382.4%Service Call
- Fire incident types reported to NFIRS in Galena, IL
- 18546.7%Structure Fires
- 11829.8%Outside Fires
- 6315.9%Mobile Property/Vehicle Fires
- 307.6%Other
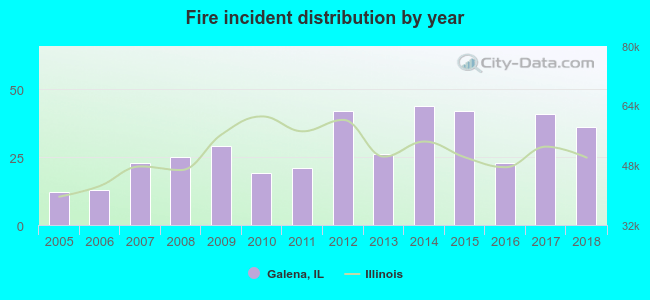 Based on the data from the years 2005 - 2018 the average number of fire incidents per year is 28. The highest number of reported fires - 44 took place in 2014, and the least - 12 in 2005. The data has a rising trend.
 27.5% incidents where reported in the morning and 72.5% in the evening. The most fires (22.5%) took place on Friday, and the least (12.1%) on Wednesday.
 Based on the 396 fire incident reports from years 2005 - 2018 most fires (15.7%) took place during March, and the least (3.5%) in June.
 Out of all 1,606 cases reported during the years 2005 - 2018, the most belonged to the categories: Overpressure Rupture (32.4%), Fire (24.7%), and Good Intent Call (18.6%).
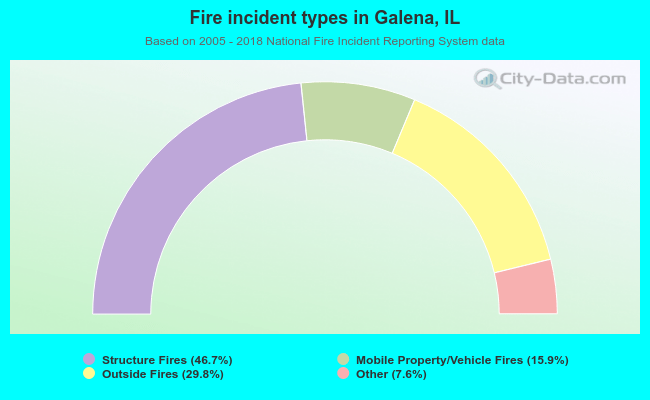 When looking into fire subcategories, the most incidents belonged to: Structure Fires (46.7%), and Outside Fires (29.8%).