Gainesville: Fire Incidents, Virginia (VA)
Where are fire incidents reported in Gainesville, VA
Something went wrong! Please refresh the page.
|
| |||||||||||||||||||||||||||||||||||||||||||||||||||||||||||||||||||||||||||||||||||||||||||||||||||||||||||||
2003 - 2018 National Fire Incident Reporting System (NFIRS) incidents
- Incident types reported to NFIRS in Gainesville, VA
- 5,67069.2%Rescue & EMS
- 85310.4%Good Intent Call
- 5897.2%False Alarm
- 4675.7%Service Call
- 2493.0%Special Incident
- 1922.3%Hazardous Condition
- 1742.1%Fire
- Fire incident types reported to NFIRS in Gainesville, VA
- 6939.7%Structure Fires
- 5933.9%Outside Fires
- 2514.4%Mobile Property/Vehicle Fires
- 2112.1%Other
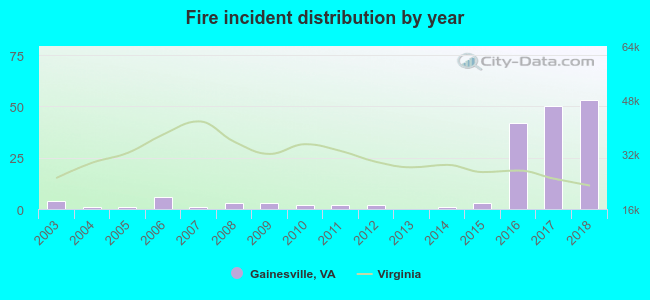 Based on the data from the years 2003 - 2018 the average number of fire incidents per year is 11. The highest number of reported fire incidents - 53 took place in 2018, and the least - 0 in 2013. The data has an increasing trend.
The average number of yearly fire incidents per 10k residents in Gainesville, VA compared to nearest cities:
(Note: Based on data for the last 3 years, including only cities with population 5,000 and above)
| Gainesville: | 42.1 |
| Manassas: | 101.6 |
| Yorkshire: | 1.3 |
| Manassas Park: | 17.4 |
| Stone Ridge: | 1.4 |
| Centreville: | 14.7 |
| South Riding: | 2.5 |
| Warrenton: | 105.3 |
| Chantilly: | 39.8 |
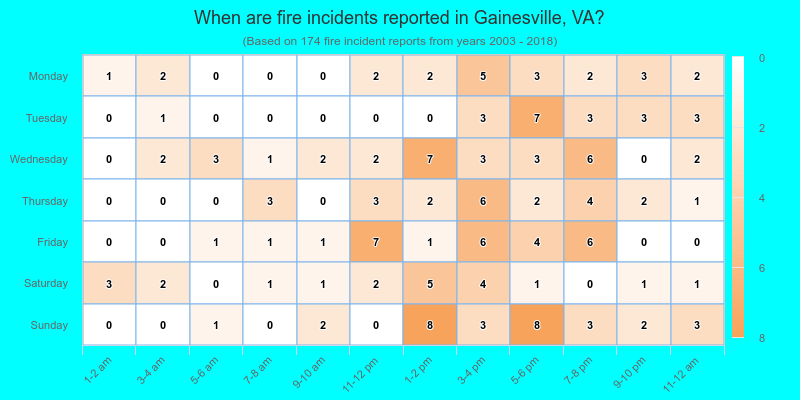
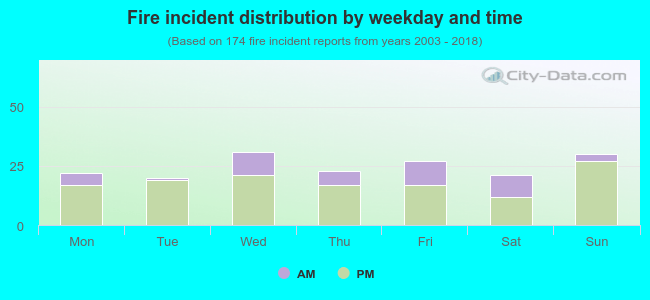 25.3% incidents where reported in the morning and 74.7% in the evening. The most fires (17.8%) took place on Wednesday, and the least (11.5%) on Tuesday.
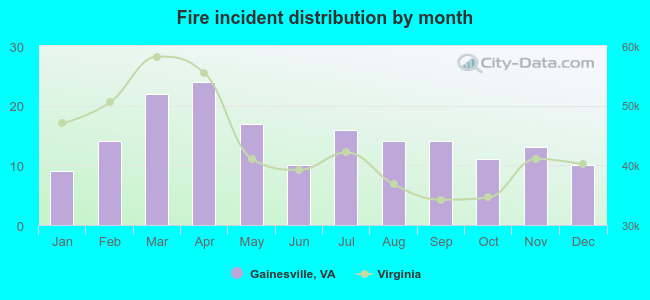 According to the 174 reports from years 2003 - 2018 most fires (13.8%) took place during April, and the least (5.2%) in January.
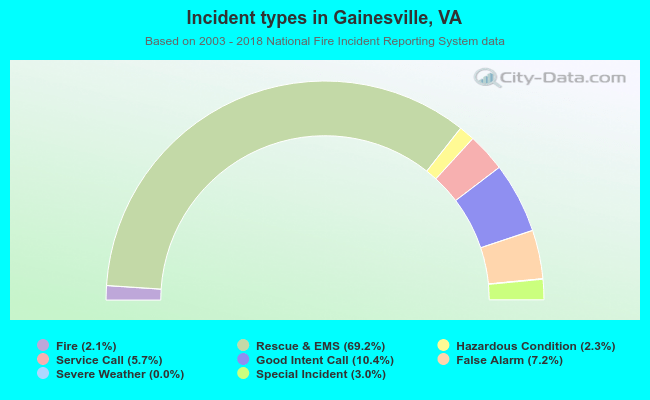 Out of all 8,198 cases reported during the years 2003 - 2018, the most belonged to the categories: Overpressure Rupture (69.2%), Service Call (10.4%), and Good Intent Call (7.2%).
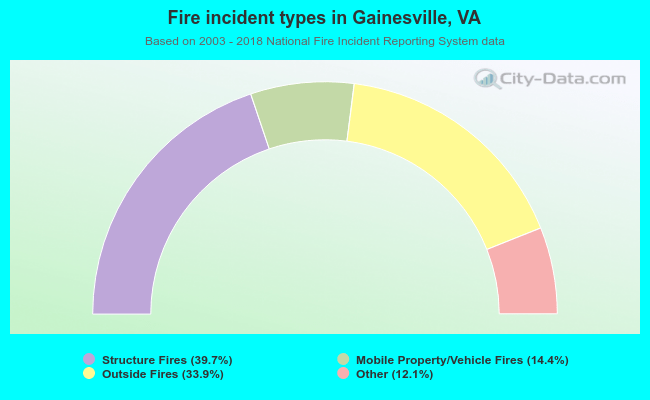 When looking into fire subcategories, the most reports belonged to: Structure Fires (39.7%), and Outside Fires (33.9%).