| Fire incidents reported |
|---|
| Sreet name | Count |
|---|
| HURDS CORNER RD | 18 | | STATE ST | 14 | | DICKERSON RD | 12 | | LINCOLN ST | 12 | | MCGREGORY RD | 12 | | CEDAR RUN RD | 10 | | DODGE RD | 10 | | DALE RD | 8 | | HOBART RD | 8 | | HOPPE RD | 8 | | MILL ST | 8 | | SOUTH ST | 8 | | COLWOOD RD | 6 | | GAGE ST | 6 | | JACOB RD | 6 | | WALSH RD | 6 | | ELKTON RD | 4 | | ELMWOOD RD | 4 | | GAGETOWN RD | 4 | | HURDS CORNER | 4 | | MILLIGAN RD | 4 | | REAGH RD | 4 | | RICHIE RD | 4 | | 2608 E DICKERSON RD | 2 | | 3733 BAYCITY-FORESTVILLE RD | 2 |
| | | Fire incidents reported |
|---|
| Sreet name | Count |
|---|
| BACH RD | 2 | | BAY CITY-FORESTVILLE RD | 2 | | BAY CITY FORESTVILLE RD | 2 | | BAY CITY FORRESTVILLE RD | 2 | | BAY CITY-FORESTVILLE RD | 2 | | BAYCITY/FORESTVILLE RD | 2 | | CARO | 2 | | CARO RD | 2 | | CASS CITY RD | 2 | | CEDAR RUN | 2 | | CEDAR RUN ROAD | 2 | | COLWOOD ROAD | 2 | | DELONG RD | 2 | | DODGE ROAD | 2 | | ELIZABETH ST | 2 | | FIFTH ST | 2 | | FIRST STRE | 2 | | GAGE STRE | 2 | | GREEN | 2 | | HOBART | 2 | | HURDS CORNER & HOBART RDS | 2 | | HURDS CORNER RD | 2 | | HURON LINE AND NOTTER RD | 2 | | HUTCHINGSON RD | 2 | | |
|
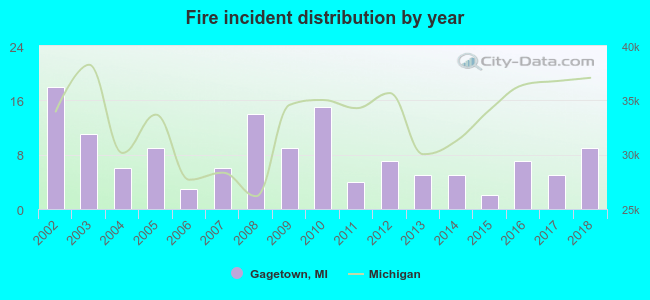 Based on the data from the years 2002 - 2018 the average number of fire incidents per year is 8. The highest number of reported fire incidents - 18 took place in 2002, and the least - 2 in 2015. The data has a decreasing trend.
 32.6% incidents where reported in the morning and 67.4% in the evening. The most fires (19.3%) took place on Monday, and the least (10.4%) on Saturday.
 Based on the 135 incident reports from years 2002 - 2018 most fires (18.5%) took place during August, and the least (0.7%) in February.
 Out of all 242 cases reported during the years 2002 - 2018, the most belonged to the categories: Fire (55.8%), Rescue & EMS (26.0%), and Overpressure Rupture (10.3%).
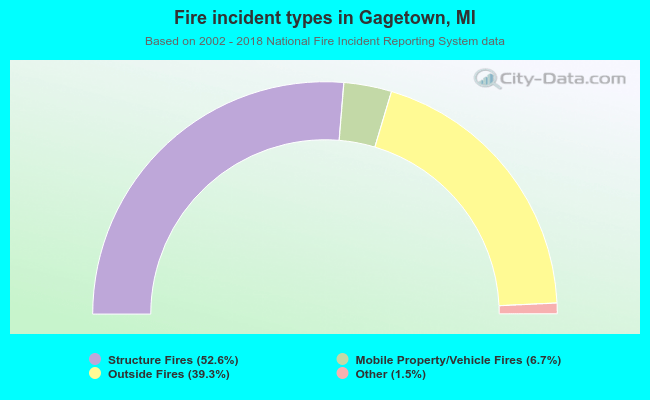 When looking into fire subcategories, the most reports belonged to: Structure Fires (52.6%), and Outside Fires (39.3%).