Fuquay-Varina: Fire Incidents, North Carolina (NC)
Where are fire incidents reported in Fuquay-Varina, NC
Something went wrong! Please refresh the page.
| Fire incidents reported | |
|---|---|
| Sreet name | Count |
| MAIN ST | 232 |
| BROAD ST | 134 |
| HOLLAND RD | 52 |
| NC 55 HWY | 52 |
| JOHNSON POND RD | 44 |
| HILLTOP-NEEDMORE RD | 42 |
| SUNSET LAKE RD | 36 |
| WAGSTAFF RD | 36 |
| NC 42 HWY | 30 |
| ANGIER RD | 28 |
| PURFOY RD | 24 |
| SUNSET DR | 24 |
| ACADEMY ST | 22 |
| FAYETTEVILLE RD | 22 |
| HILLTOP RD | 20 |
| PINEY GROVE-WILBON RD | 20 |
| COLEY FARM RD | 18 |
| JAMES SLAUGHTER RD | 18 |
| OLD HONEYCUTT RD | 18 |
| RANSOM ST | 18 |
| STEWART ST | 18 |
| BURT RD | 16 |
| DICKENS RD | 16 |
| LARK ST | 16 |
| WEST ST | 16 |
| WILBON RD | 16 |
| OLD STAGE RD | 14 |
| BASS LAKE RD | 12 |
| OLD POWELL RD | 12 |
| BRIDGE ST | 10 |
| Other | 70 |
2002 - 2011 National Fire Incident Reporting System (NFIRS) incidents
- Incident types reported to NFIRS in Fuquay-Varina, NC
- 2,90948.9%Rescue & EMS
- 1,10618.6%Fire
- 98516.6%Hazardous Condition
- 3836.4%False Alarm
- 3485.8%Service Call
- 1262.1%Good Intent Call
- 891.5%Severe Weather
- Fire incident types reported to NFIRS in Fuquay-Varina, NC
- 46842.3%Outside Fires
- 42438.3%Structure Fires
- 21019.0%Mobile Property/Vehicle Fires
- 40.4%Other
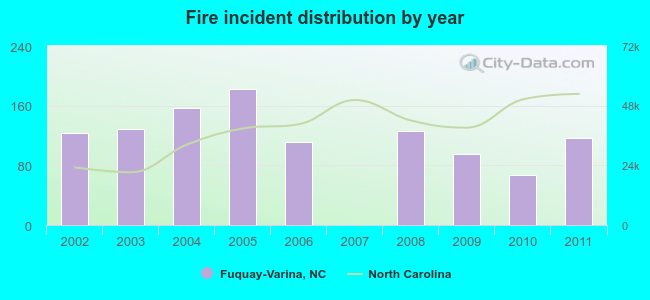 Based on the data from the years 2002 - 2011 the average number of fire incidents per year is 111. The highest number of reported fire incidents - 182 took place in 2005, and the least - 0 in 2007. The data has a decreasing trend.
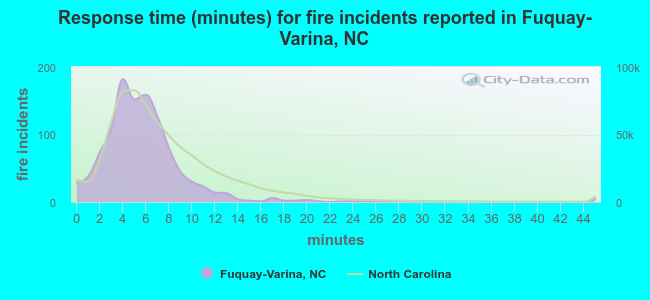 The median response time based on all reported fire incidents is 5 minutes. This is lower compared to the North Carolina median value.
The median response time in Fuquay-Varina, NC compared to nearest cities:
(Note: Based on data for all years, including only cities with at least 500 fire incidents)
| Fuquay-Varina: | 5 minutes |
| Holly Springs: | 6 minutes |
| Angier: | 9 minutes |
| Apex: | 6 minutes |
| Garner: | 5 minutes |
| Cary: | 5 minutes |
| Lillington: | 9 minutes |
| Coats: | 8 minutes |
| Morrisville: | 6 minutes |
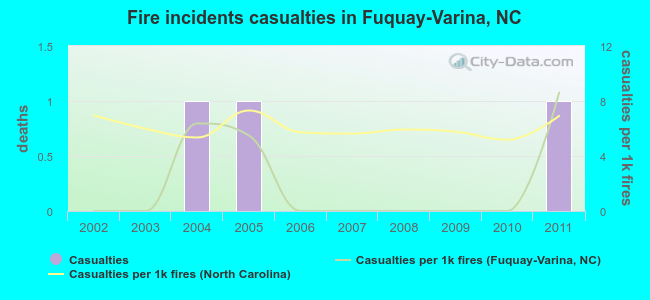 Based on the reports from the years 2002 - 2011 the average number of fire-related casualties per year is 0. The highest number of reported casualties - 1 took place in 2004, and the lowest - 0 in 2002. The data has an increasing trend.
The average number of casualties per 1,000 fires is 2. This indicator was the highest - 9 in 2011, and the lowest 0 in 2002. The trend for injuries per 1,000 incidents is increasing. Compared to the state value the number of casualties per 1,000 incidents is much lower.
Based on the reports from the years 2002 - 2011 the average number of fire-related casualties per year is 0. The highest number of reported casualties - 1 took place in 2004, and the lowest - 0 in 2002. The data has an increasing trend.
The average number of casualties per 1,000 fires is 2. This indicator was the highest - 9 in 2011, and the lowest 0 in 2002. The trend for injuries per 1,000 incidents is increasing. Compared to the state value the number of casualties per 1,000 incidents is much lower.Casualties per 1,000 incidents in Fuquay-Varina, NC compared to nearest cities:
(Note: Based on data for all years, including only cities with at least 500 fire incidents)
| Fuquay-Varina: | 2.7 |
| Holly Springs: | 2.5 |
| Angier: | 1.1 |
| Apex: | 6.6 |
| Garner: | 2.4 |
| Cary: | 12.2 |
| Lillington: | 2.7 |
| Coats: | 4.7 |
| Morrisville: | 6.8 |
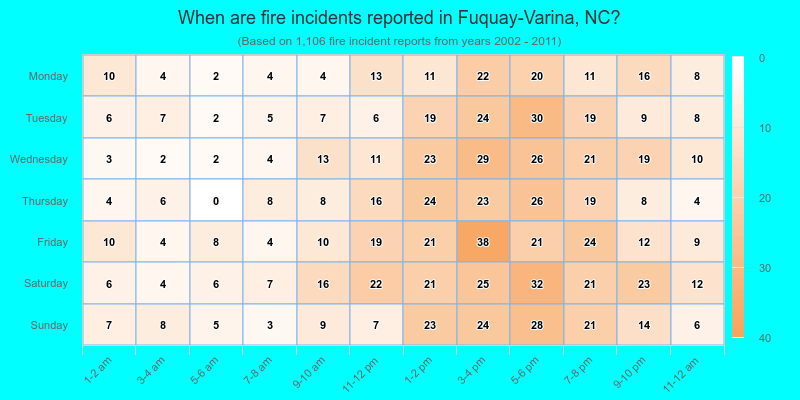
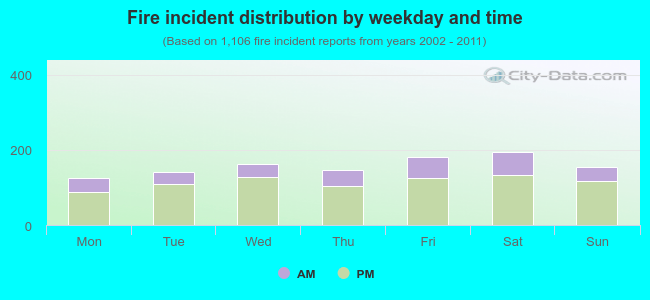 27.3% incidents where reported in the morning and 72.7% in the evening. The most fires (17.6%) took place on Saturday, and the least (11.3%) on Monday.
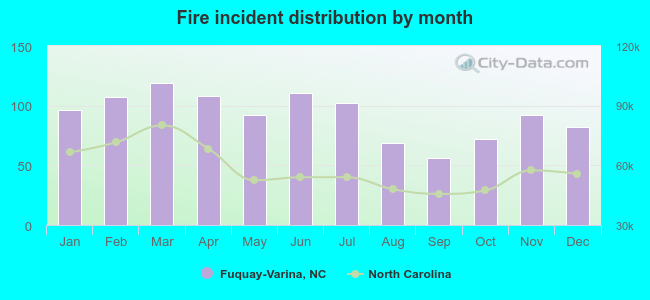 Based on the 1,106 fires from years 2002 - 2011 most fires (10.8%) took place during March, and the least (5.1%) in September.
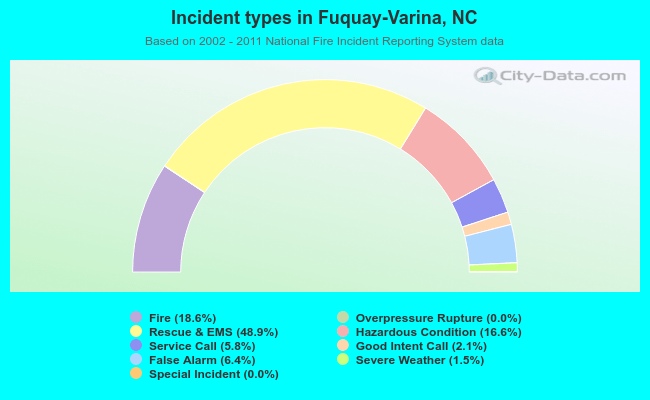 Out of all 5,949 cases reported during the years 2002 - 2011, the most belonged to the categories: Rescue & EMS (48.9%), Fire (18.6%), and Hazardous Condition (16.6%).
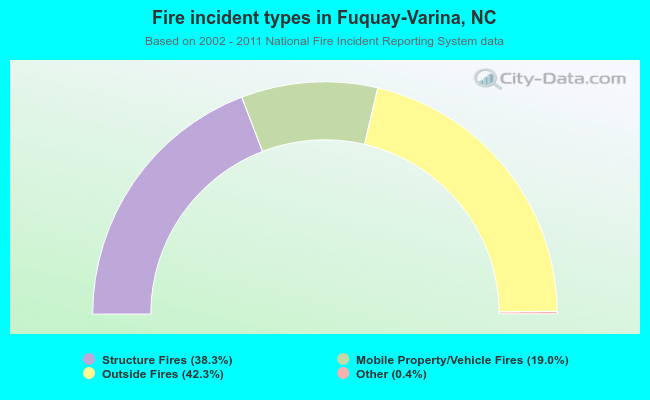 When looking into fire subcategories, the most reports belonged to: Outside Fires (42.3%), and Structure Fires (38.3%).