Fulton: Fire Incidents, Illinois (IL)
Where are fire incidents reported in Fulton, IL
Something went wrong! Please refresh the page.
|
| |||||||||||||||||||||||||||||||||||||||||||||||||||||||||||||||||||||||||||||||||||||||||||||||||||||||||||||
2002 - 2018 National Fire Incident Reporting System (NFIRS) incidents
- Incident types reported to NFIRS in Fulton, IL
- 42538.0%Fire
- 20918.7%Rescue & EMS
- 20318.1%Hazardous Condition
- 948.4%False Alarm
- 776.9%Good Intent Call
- 716.3%Service Call
- 211.9%Severe Weather
- 141.3%Special Incident
- 50.4%Overpressure Rupture
- Fire incident types reported to NFIRS in Fulton, IL
- 17841.9%Outside Fires
- 14834.8%Structure Fires
- 5011.8%Other
- 4911.5%Mobile Property/Vehicle Fires
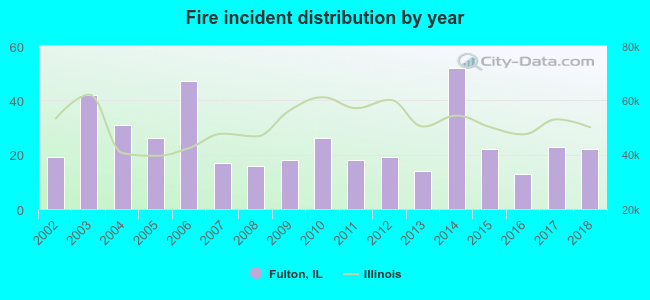 Based on the data from the years 2002 - 2018 the average number of fire incidents per year is 25. The highest number of reported fires - 52 took place in 2014, and the least - 13 in 2016. The data has a rising trend.
 Based on the data from the years 2002 - 2018 the average number of fire-related casualties per year is 0. The highest number of casualties - 2 took place in 2010, and the lowest - 0 in 2002. The data has a constant trend.
 25.4% incidents where reported in the morning and 74.6% in the evening. The most fires (16.2%) took place on Friday, and the least (12.5%) on Wednesday.
 Based on the 425 reports from years 2002 - 2018 most fires (20.0%) took place during April, and the least (4.0%) in July.
 Out of all 1,119 cases reported during the years 2002 - 2018, the most belonged to the categories: Fire (38.0%), Rescue & EMS (18.7%), and Hazardous Condition (18.1%).
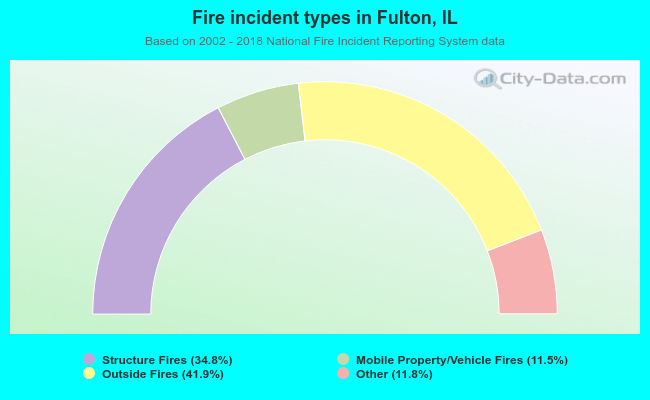 When looking into fire subcategories, the most incidents belonged to: Outside Fires (41.9%), and Structure Fires (34.8%).