Fruitport: Fire Incidents, Michigan (MI)
Where are fire incidents reported in Fruitport, MI
Something went wrong! Please refresh the page.
|
| |||||||||||||||||||||||||||||||||||||||||||||||||||||||||||||||||||||||||||||||||||||||||||||||||||||||||||||
2002 - 2018 National Fire Incident Reporting System (NFIRS) incidents
- Incident types reported to NFIRS in Fruitport, MI
- 20727.2%Rescue & EMS
- 20026.3%Fire
- 18324.1%Good Intent Call
- 10613.9%Hazardous Condition
- 354.6%Service Call
- 273.6%False Alarm
- 10.1%Overpressure Rupture
- 10.1%Special Incident
- Fire incident types reported to NFIRS in Fruitport, MI
- 15075.0%Structure Fires
- 2211.0%Outside Fires
- 189.0%Mobile Property/Vehicle Fires
- 105.0%Other
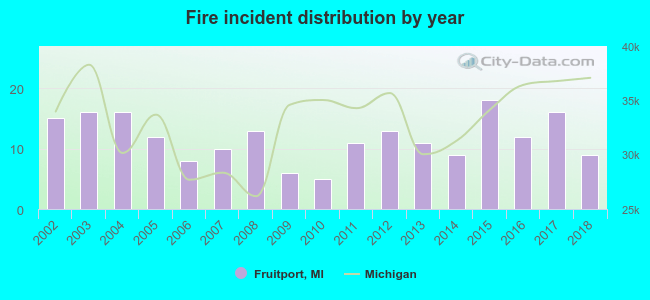 Based on the data from the years 2002 - 2018 the average number of fire incidents per year is 12. The highest number of reported fire incidents - 18 took place in 2015, and the least - 5 in 2010. The data has a decreasing trend.
 37.0% incidents where reported in the morning and 63.0% in the evening. The most fires (18.0%) took place on Friday, and the least (10.5%) on Monday.
 Based on the 200 incident reports from years 2002 - 2018 most fires (12.0%) took place during April, and the least (3.5%) in September.
 Out of all 760 cases reported during the years 2002 - 2018, the most belonged to the categories: Rescue & EMS (27.2%), Fire (26.3%), and Good Intent Call (24.1%).
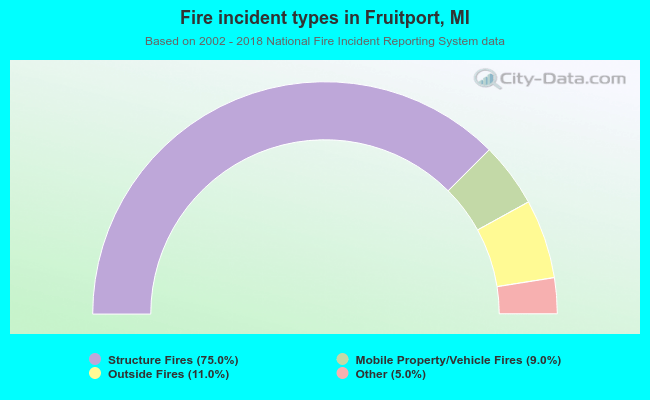 When looking into fire subcategories, the most reports belonged to: Structure Fires (75.0%), and Outside Fires (11.0%).