| Fire incidents reported |
|---|
| Sreet name | Count |
|---|
| HWY 36 | 12 | | HWY 460 E | 6 | | HWY 460 W | 6 | | MAIN STREET | 6 | | ROTHWELL HILL | 6 | | 1418 AMOS RIDGE ROAD | 4 | | 304 INDIAN CREEK ROAD | 4 | | 317 ROBINSON LANE | 4 | | 707 SHOTGUN HOLLOW | 4 | | 1010 MCCAUSEY RIDGE ROAD | 2 | | 108 PARKWAY LANE | 2 | | 109 ROSE LANE | 2 | | 124 BLAKE DRIVE | 2 | | 129 WELLS RATLIFF CEMETERY RD | 2 | | 13 ABNEY RIDGE ROAD | 2 | | 134 TOWER ROAD | 2 | | 145 WALNUT DRIVE | 2 | | 1487 HWY 1274 | 2 | | 159 STILTNER LANE LGTS | 2 | | 162 TOLAN RD | 2 | | 1670 SCIENCE RIDGE ROAD | 2 | | 172 BLACKBERRY LANE | 2 | | 1744 KENDRICK RIDGE RD | 2 | | 18 MAYNARD LANE | 2 | | 1902 KENDRICK RIDGE RD | 2 |
| | | Fire incidents reported |
|---|
| Sreet name | Count |
|---|
| 202 MAIN STREET | 2 | | 213 MAIN STREET | 2 | | 223 BOB FIELD TRAIL | 2 | | 223 BOB FIELDS TRAIL | 2 | | 2283 BIG SALT LICK RD | 2 | | 2349 INDIAN CREEK ROAD | 2 | | 2400 BIG SLAT LICK RD | 2 | | 2406 KENDRICK RIDGE ROAD | 2 | | 241 NOLAN ROAD | 2 | | 244 PUGH BRANCH ROAD | 2 | | 248 INDIAN CREEK RD | 2 | | 252 JOE HARMON RD | 2 | | 252 JOE HARMON ROAD | 2 | | 2539 INDIAN CREEK ROAD | 2 | | 2597 TARR RIDGE ROAD LGTS | 2 | | 260 ADAMS RIDGE RD | 2 | | 27 ROBINFIELD ROAD | 2 | | 286 CAMPUS ROAD | 2 | | 294 AMOS RIDGE RD | 2 | | 294 AMOS RIDGE ROAD | 2 | | 303 STONE QUARRY RD | 2 | | 3083 HWY 36 | 2 | | 3216 AMOS RIDGE RD | 2 | | 325 MAIN STREET | 2 | | |
|
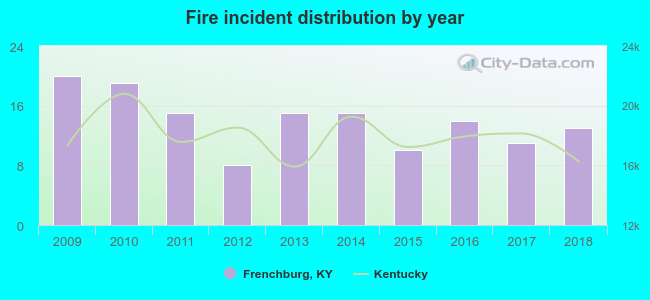 Based on the data from the years 2009 - 2018 the average number of fire incidents per year is 14. The highest number of reported fire incidents - 20 took place in 2009, and the least - 8 in 2012. The data has a declining trend.
 27.1% incidents where reported in the morning and 72.9% in the evening. The most fires (22.9%) took place on Saturday, and the least (7.1%) on Sunday.
 According to the 140 incident reports from years 2009 - 2018 most fires (20.7%) took place during April, and the least (2.9%) in December.
 Out of all 536 cases reported during the years 2009 - 2018, the most belonged to the categories: Rescue & EMS (44.0%), Fire (26.1%), and Special Incident (13.4%).
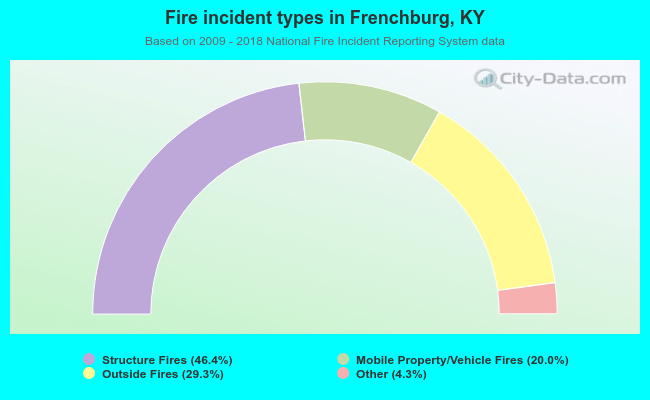 When looking into fire subcategories, the most incidents belonged to: Structure Fires (46.4%), and Outside Fires (29.3%).