Frederick: Fire Incidents, Maryland (MD)
Where are fire incidents reported in Frederick, MD
Something went wrong! Please refresh the page.
| Fire incidents reported | |
|---|---|
| Sreet name | Count |
| PATRICK ST | 806 |
| MARKET ST | 632 |
| BUCKEYSTOWN PIKE | 386 |
| SOUTH ST | 342 |
| WAVERLEY DR | 286 |
| TAMKO DR | 280 |
| WILLOWDALE DR | 256 |
| TANEY AVE | 246 |
| SEVENTH ST | 236 |
| HEATHER RIDGE DR | 216 |
| LIBERTY RD | 186 |
| EAST ST | 184 |
| URBANA PIKE | 170 |
| REICHS FORD RD | 168 |
| JEFFERSON PIKE | 154 |
| SPECTRUM DR | 154 |
| CHURCH ST | 150 |
| BETHEL RD | 142 |
| BALLENGER CREEK PIKE | 140 |
| JEFFERSON ST | 140 |
| OPOSSUMTOWN PIKE | 140 |
| INTERSTATE 70 | 130 |
| OLD NATIONAL PIKE | 130 |
| KEY PKWY | 124 |
| GAMBRILL PARK RD | 122 |
| PROSPECT BLVD | 122 |
| THOMAS JOHNSON DR | 112 |
| KEY | 108 |
| JEFFERSON BLVD | 104 |
| MOTTER AVE | 96 |
| Other | 4,809 |
2002 - 2018 National Fire Incident Reporting System (NFIRS) incidents
- Incident types reported to NFIRS in Frederick, MD
- 17,32729.8%Rescue & EMS
- 11,27119.4%Fire
- 11,15819.2%Good Intent Call
- 7,26512.5%Hazardous Condition
- 6,29110.8%False Alarm
- 4,3587.5%Service Call
- 3110.5%Special Incident
- 2030.3%Overpressure Rupture
- Fire incident types reported to NFIRS in Frederick, MD
- 6,75259.9%Structure Fires
- 2,52822.4%Outside Fires
- 1,13310.1%Mobile Property/Vehicle Fires
- 8587.6%Other
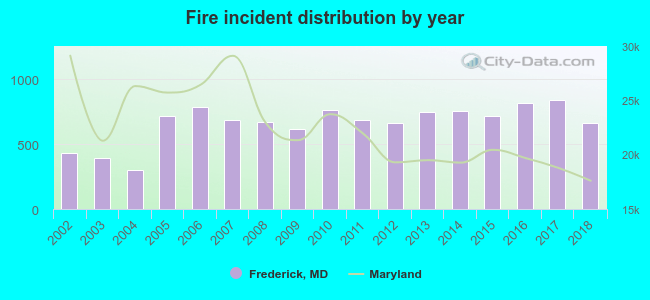 According to the data from the years 2002 - 2018 the average number of fire incidents per year is 663. The highest number of fires - 839 took place in 2017, and the least - 300 in 2004. The data has a growing trend.
The average number of yearly fire incidents per 10k residents in Frederick, MD compared to nearest cities:
(Note: Based on data for the last 3 years, including only cities with population 5,000 and above)
| Frederick: | 113.2 |
| Walkersville: | 74.8 |
| Urbana: | 2.2 |
| Brunswick: | 57.4 |
| Thurmont: | 164.6 |
| Mount Airy: | 65.0 |
| Damascus: | 15.7 |
| Clarksburg: | 18.6 |
| Germantown: | 10.3 |
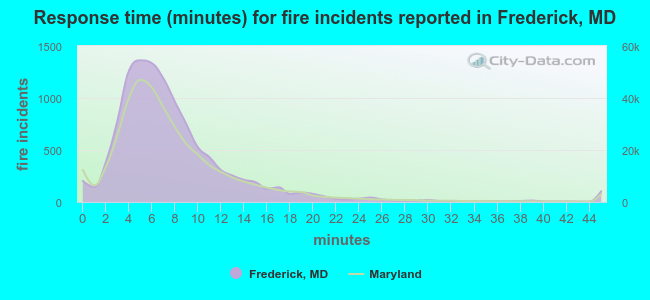 The median response time based on all reported fire incidents is 7 minutes. This is similar to the state median value.
The median response time in Frederick, MD compared to nearest cities:
(Note: Based on data for all years, including only cities with at least 500 fire incidents)
| Frederick: | 7 minutes |
| Walkersville: | 8 minutes |
| Middletown: | 9 minutes |
| Jefferson: | 9 minutes |
| New Market: | 9 minutes |
| Monrovia: | 8 minutes |
| Myersville: | 10 minutes |
| Brunswick: | 9 minutes |
| Boonsboro: | 10 minutes |
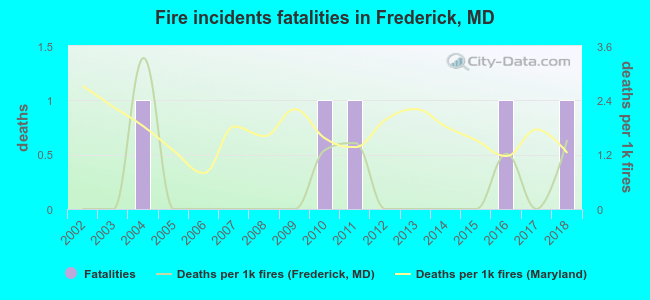 According to the reports from the years 2002 - 2018 the average number of fire-related yearly deaths is 0. The highest number of deaths - 1 took place in 2004, and the lowest - 0 in 2002. The data has a rising trend.
The average number of deaths per 1,000 fire incidents is 1. This indicator was the highest - 3 in 2004, and the lowest 0 in 2002. The trend for deaths per 1,000 fire incidents is growing. Compared to the Maryland value the number of fatalities per 1,000 fire incidents is much lower.
According to the reports from the years 2002 - 2018 the average number of fire-related yearly deaths is 0. The highest number of deaths - 1 took place in 2004, and the lowest - 0 in 2002. The data has a rising trend.
The average number of deaths per 1,000 fire incidents is 1. This indicator was the highest - 3 in 2004, and the lowest 0 in 2002. The trend for deaths per 1,000 fire incidents is growing. Compared to the Maryland value the number of fatalities per 1,000 fire incidents is much lower.Deaths per 1,000 incidents in Frederick, MD compared to nearest cities:
(Note: Based on data for all years, including only cities with at least 2,500 fire incidents)
| Frederick: | 0.4 |
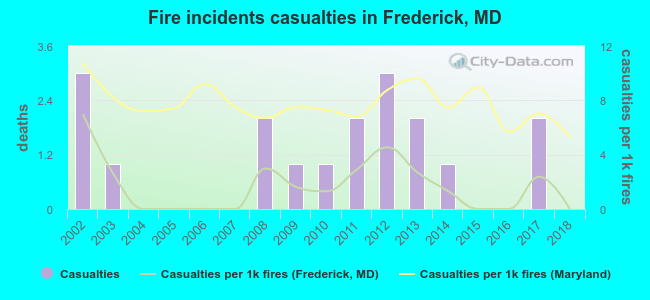 Based on the reports from the years 2002 - 2018 the average number of fire-related casualties per year is 1. The highest number of casualties - 3 took place in 2002, and the lowest - 0 in 2004. The data has a declining trend.
The average number of injuries per 1,000 fire incidents is 2. This indicator was the highest - 7 in 2002, and the lowest 0 in 2004. The trend for injuries per 1,000 incidents is dropping. Compared to the Maryland value the number of casualties per 1,000 fires is much lower.
Based on the reports from the years 2002 - 2018 the average number of fire-related casualties per year is 1. The highest number of casualties - 3 took place in 2002, and the lowest - 0 in 2004. The data has a declining trend.
The average number of injuries per 1,000 fire incidents is 2. This indicator was the highest - 7 in 2002, and the lowest 0 in 2004. The trend for injuries per 1,000 incidents is dropping. Compared to the Maryland value the number of casualties per 1,000 fires is much lower.Casualties per 1,000 incidents in Frederick, MD compared to nearest cities:
(Note: Based on data for all years, including only cities with at least 500 fire incidents)
| Frederick: | 1.6 |
| Walkersville: | 5.1 |
| Middletown: | 1.0 |
| Jefferson: | 1.6 |
| New Market: | 2.4 |
| Monrovia: | 3.1 |
| Myersville: | 0.0 |
| Brunswick: | 0.0 |
| Boonsboro: | 0.8 |
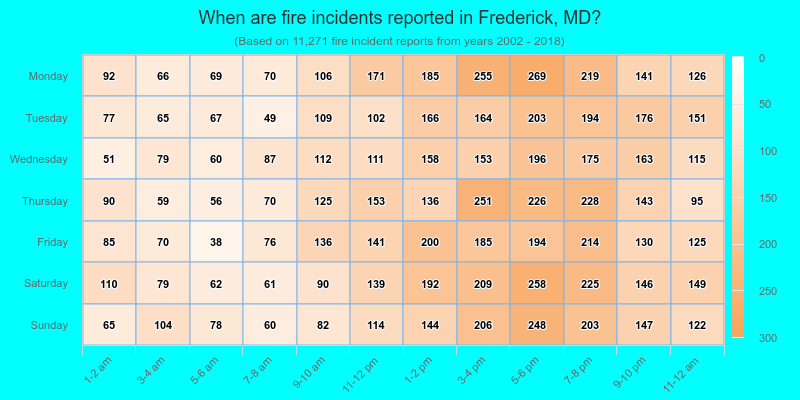
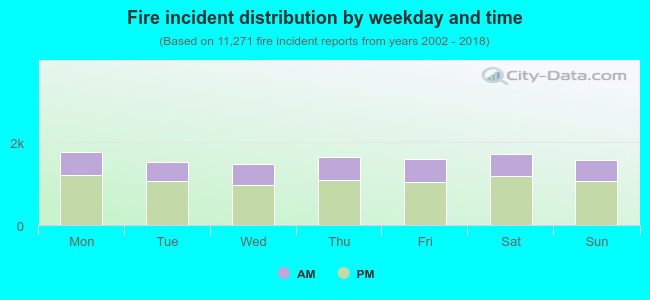 32.7% incidents where reported in the morning and 67.3% in the evening. The most fires (15.7%) took place on Monday, and the least (13.0%) on Wednesday.
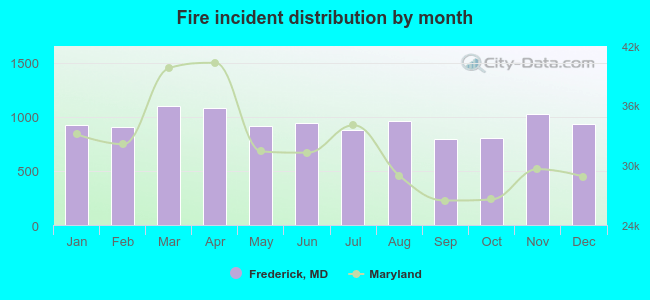 Based on the 11,271 incident reports from years 2002 - 2018 most fires (9.8%) took place during March, and the least (7.0%) in September.
 Out of all 58,227 cases reported during the years 2002 - 2018, the most belonged to the categories: Rescue & EMS (29.8%), Fire (19.4%), and Good Intent Call (19.2%).
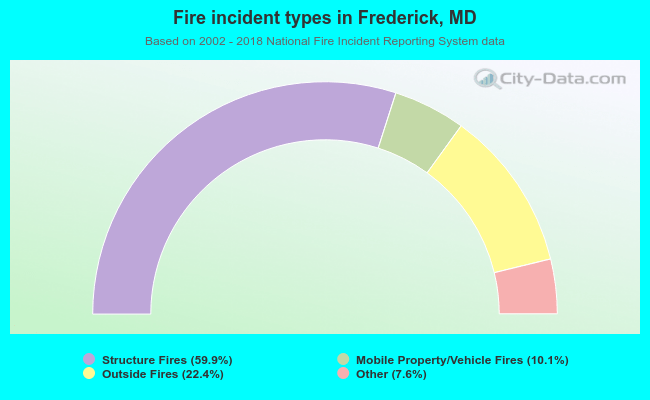 When looking into fire subcategories, the most incidents belonged to: Structure Fires (59.9%), and Outside Fires (22.4%).