| Fire incidents reported |
|---|
| Sreet name | Count |
|---|
| LEHIGH AVE | 18 | | RAILROAD (43) ST | 18 | | BALLIET ST | 10 | | INTERSTATE 81 | 8 | | LEHIGH ST | 8 | | MIDDLE ST | 8 | | NICE (43) ST | 8 | | LEHIGH AVE | 6 | | NICE ST | 6 | | RAILROAD ST | 6 | | 2ND ST | 4 | | I 81 (04) HWY | 4 | | I 81 ??(04) HWY | 4 | | MALL ROAD | 4 | | RAILROAD AVE | 4 | | RAILROAD43 ST | 4 | | SECOND (43) ST | 4 | | SPRING (43) ST | 4 | | SPRING ST | 4 | | 124 MM I81 NORTH | 2 | | 4TH STREET | 2 | | 50 MALL ROAD | 2 | | 501 SOUTH LINE | 2 | | BALLIET STREET | 2 | | BALLIET43 ST | 2 |
| | | Fire incidents reported |
|---|
| Sreet name | Count |
|---|
| BALLIETT ST | 2 | | BIRCH STREET | 2 | | BROAD MOUNTAIN (43) AVE | 2 | | BROAD MOUNTAIN AVE | 2 | | BROAD MOUNTAIN43 AVE | 2 | | CENTER ST | 2 | | CENTRE ??(43) ST | 2 | | CHERRY ST | 2 | | CHERRY43 ST | 2 | | CITY SHIRT ROAD | 2 | | FOUNTAIN (04) ST | 2 | | FOURTH ST | 2 | | FRACK ST | 2 | | HOWARD AVE | 2 | | HOWARD ST | 2 | | I81 MILE MARKER 121 NORTH | 2 | | I81SB | 2 | | INTERSTATE 81 HWY | 2 | | INTERSTATE 81 SOUTH | 2 | | INTERSTATE I 81 HWY | 2 | | JOHN ST | 2 | | LAUREL STREET | 2 | | LEHIGH (36) AVE | 2 | | LEHIGH43 AVE | 2 | | |
|
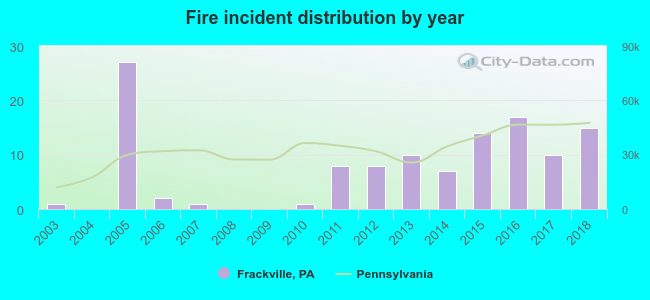 Based on the data from the years 2003 - 2018 the average number of fire incidents per year is 8. The highest number of reported fires - 27 took place in 2005, and the least - 0 in 2004. The data has an increasing trend.
 37.2% incidents where reported in the morning and 62.8% in the evening. The most fires (24.0%) took place on Monday, and the least (8.3%) on Saturday.
 Based on the 121 fires from years 2003 - 2018 most fires (15.7%) took place during January, and the least (3.3%) in July.
 Out of all 510 cases reported during the years 2003 - 2018, the most belonged to the categories: Fire (23.7%), Hazardous Condition (20.6%), and Good Intent Call (20.2%).
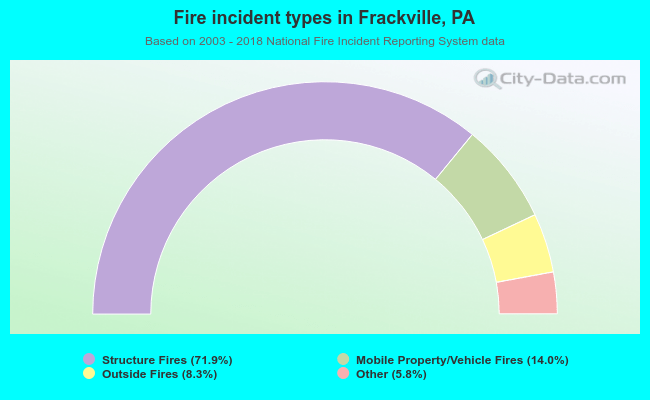 When looking into fire subcategories, the most incidents belonged to: Structure Fires (71.9%), and Mobile Property/Vehicle Fires (14.0%).